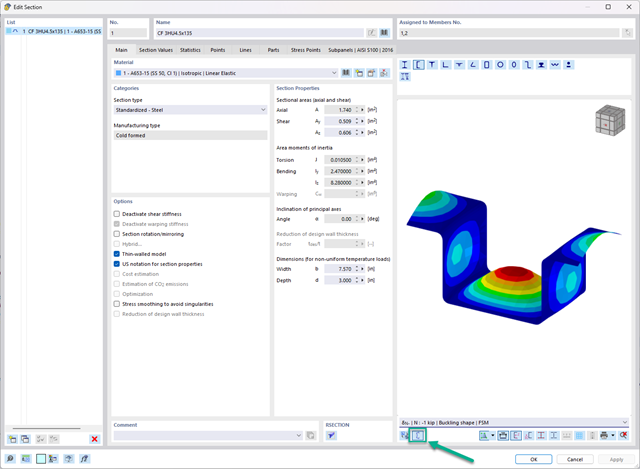
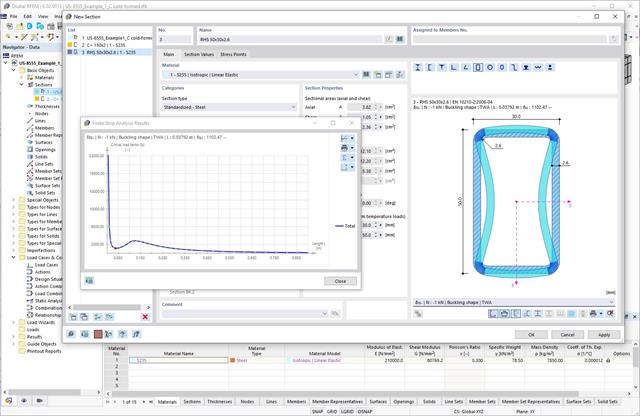
In the "Edit Section" dialog box, you can display the buckling shapes of the Finite Strip Method (FSM) as a 3D graphic.
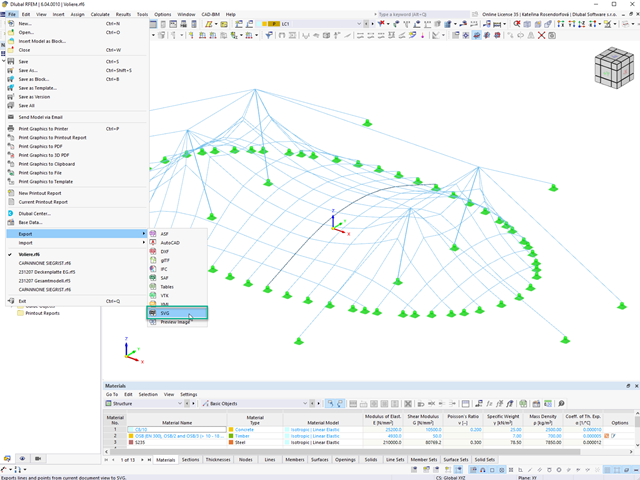
In RFEM 6 and RSTAB 9, you can export line graphics to the SVG format (vector graphics).
SVG stands for Scalable Vector Graphics and is an XML-based file format for displaying two-dimensional vector graphics. These vector graphics can be scaled without loss. It is possible to edit the SVG files using text editors, embed them on websites, and open them in the usual browsers.
- Analysis of time diagrams and accelerograms (acceleration-time diagrams exciting the supports of a structure)
- Combination of user-defined time diagrams with nodal, member, and surface loads, as well as free and generated loads
- Combination of several independent excitation functions
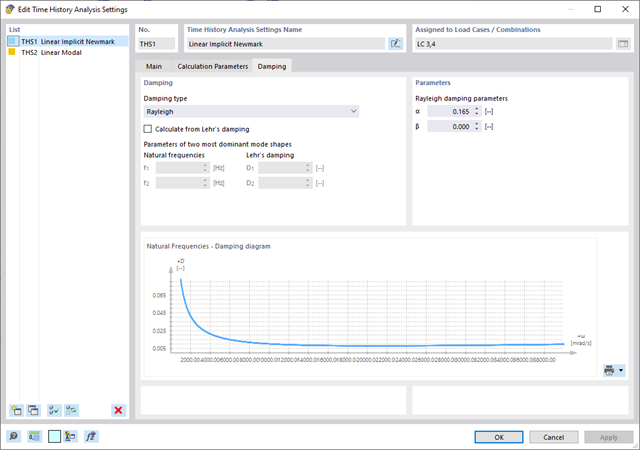
- Linear implicit Newmark analysis or modal analysis in time history
- Structural damping using Raleigh damping coefficients or Lehr's damping value
- Graphical display of results in calculation diagrams
- Result display in individual time steps or as an envelope during the entire time period
- Extensive library of seismic events (accelerograms)
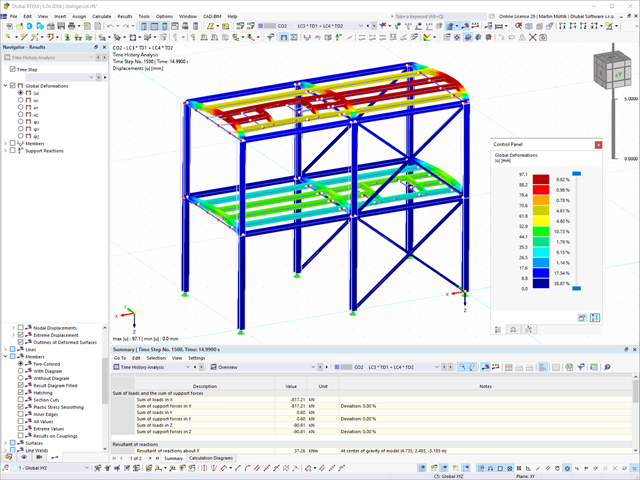
As soon as the program has completed the calculation, the summary of the results is listed. All result windows are integrated in the main program RFEM/RSTAB. You will find all the results arranged in tables; they can be displayed for each individual time step or as an envelope, and you also have the option of displaying the results graphically as well as animating them.
The results from the time history analysis can be displayed in the calculation diagrams. All the results are shown as a function of time. You can export the numeric values to MS Excel.
All result tables and graphics are part of the RFEM/RSTAB printout report. In this way, you can ensure clearly arranged documentation. You can also export the tables to MS Excel.
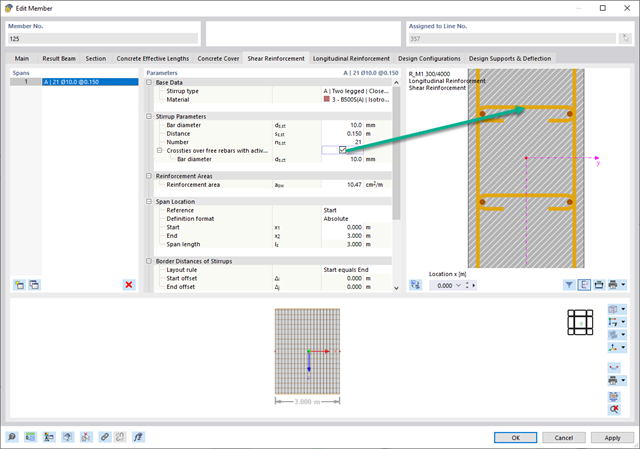
In the "Shear Reinforcement" tab, you can select the option "Cross-ties over free rebars with active selection in graphic". It allows you to arrange additional cross-ties on free rebars of the longitudinal reinforcement.
You can activate or deactivate the position of the cross-ties in the Info Graphic. The cross-ties are applied for the ultimate limit state design and the structural design checks. They are available for the design according to EN 1992‑1‑1.
Go to Explanatory Video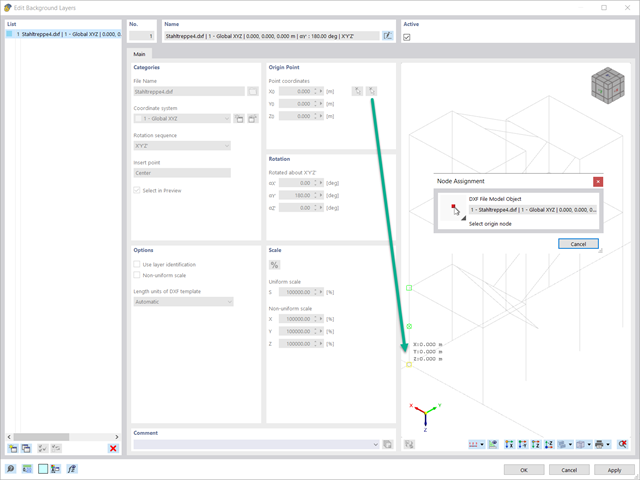
When importing DXF files as background layers, you have the option to select a reference point in the graphic preview.
- Consideration of nonlinear component behavior using plastic standard hinges for steel (FEMA 356, EN 1998‑3) and nonlinear material behavior (masonry, steel - bilinear, user-defined working curves)
- Direct import of masses from load cases or combinations for the application of constant vertical loads
- User-defined specifications for the consideration of horizontal loads (standardized to a mode shape or uniformly distributed over the height of the masses)
- Determination of a pushover curve with selectable limit criterion of the calculation (a collapse or limit deformation)
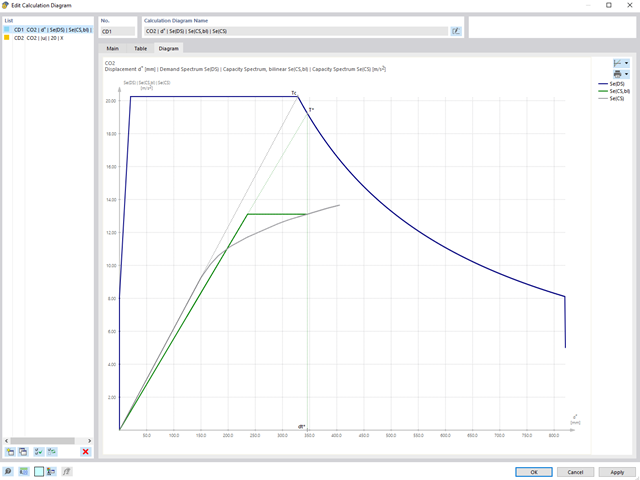
- Transformation of the pushover curve into the capacity spectrum (ADRS format, single degree of freedom system)
- Bilinearization of the capacity spectrum according to EN 1998‑1:2010 + A1:2013
- Transformation of the applied response spectrum into the required spectrum (ADRS format)
- Determination of target displacement according to EC 8 (the N2 method according to Fajfar 2000)
- Graphical comparison of the capacity and required spectrum
- Graphical evaluation of the acceptance criteria of predefined plastic hinges
- Result display of the values used in the iterative calculation of the target displacement
- Access to all results of the structural analysis in the individual load levels
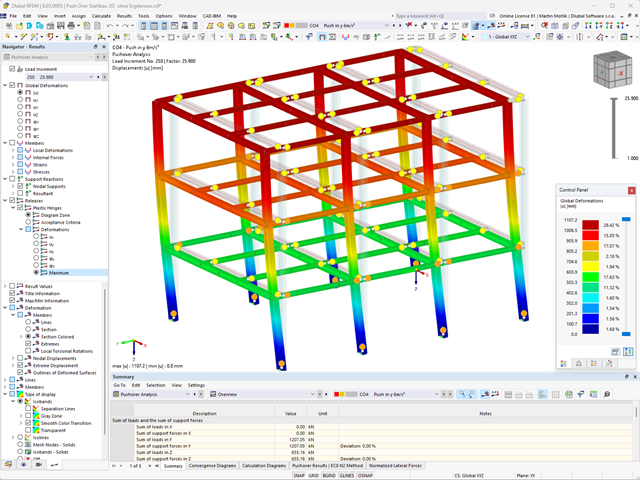
During the calculation, the selected horizontal load is increased in load steps. A static nonlinear analysis is carried out for each load step until reaching the specified limit condition.
The results of the pushover analysis are extensive. On one hand, the structure is analyzed for its deformation behavior. This can be represented by a force-deformation line of the system (a capacity curve). On the other hand, the response spectrum effect can be displayed in the ADRS display (Acceleration-Displacement Response Spectrum). The target displacement is automatically determined in the program based on these two results. The process can be evaluated graphically and in tables.
The individual acceptance criteria can then be graphically evaluated and assessed (for the next load step of the target displacement, but also for all other load steps). The results of the static analysis are also available for the individual load steps.
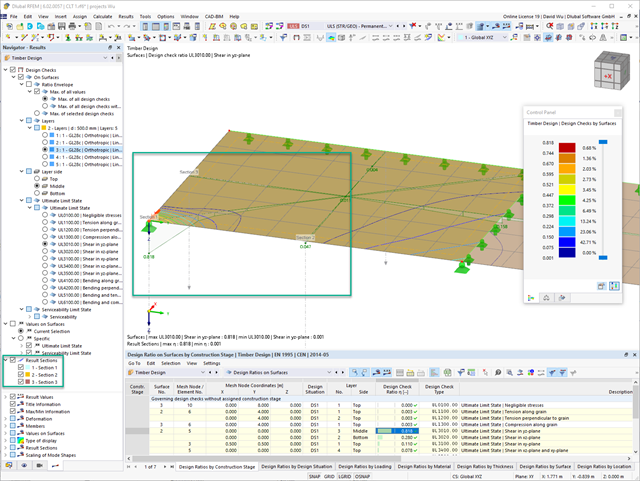
You can graphically evaluate result sections for the timber surface design. This can be done in the RFEM graphic as well as in the result history window. The sections can be placed at any location in order to evaluate the design results in detail.
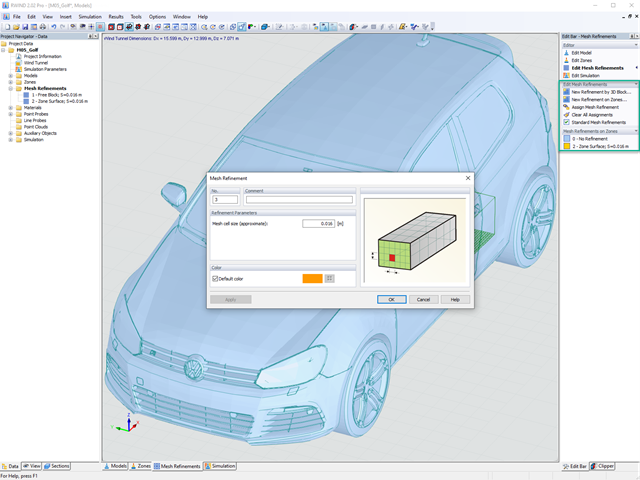
Do you already know the editor for mesh refinement control? It is a great help for your work! Why? It's easy – it gives you the following options:
- Graphic visualization of the areas with mesh refinements
- Mesh refinement of zones
- Deactivating the standard 3D solid mesh refinement with transversion into the corresponding manual 3D mesh refinements.
These options help you to formulate a suitable rule for meshing the entire model, even for the models with unusual dimensions. Use the editor to efficiently define small model details on large buildings or detailed meshing areas in the coating area of the model. You will be amazed!
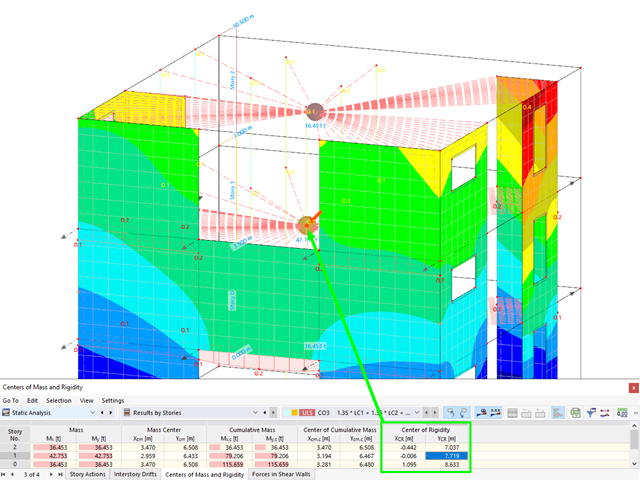
Have you activated the Building Model add-on? Very good! This allows you to display the center of rigidity in tabular and graphical form. Use it for your dynamic analysis, for example.
Have you ever wondered if you can render without a graphics card? We have the answer! Software rendering for alternative image synthesis without the support of a graphics card is possible. You can easily control this solution with the Windows command scripts:
- Enable Software Renderer.cmd (switch on)
- Disable Software Renderer.cmd (switch off)
in the program folder C:\Program Files\Dlubal\RFEM 6.02\bin.
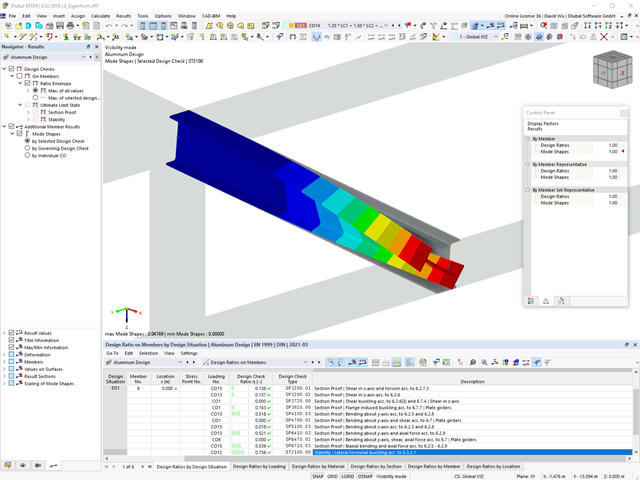
Did you use the eigenvalue solver of the add-on to determine the critical load factor within the stability analysis? In this case, you can then display the governing mode shape of the object to be designed as a result.
.png?mw=640&hash=55038d2a1591f62179796666cb9b2fede0274e19)
A graphical and tabular output of the results for deformations, stresses, and strains helps you when determining the soil solids. To achieve this, use the special filter criteria for targeted selection of results.
The program doesn't leave you alone with the results. If you want to graphically evaluate the results in the soil solids, you can use the guide objects. For example, you can define clipping planes. This allows you to view the corresponding results in any plane of the soil solid.
And not just that. The utilization of result sections and clipping boxes facilitates the precise graphical analysis of the soil solid.
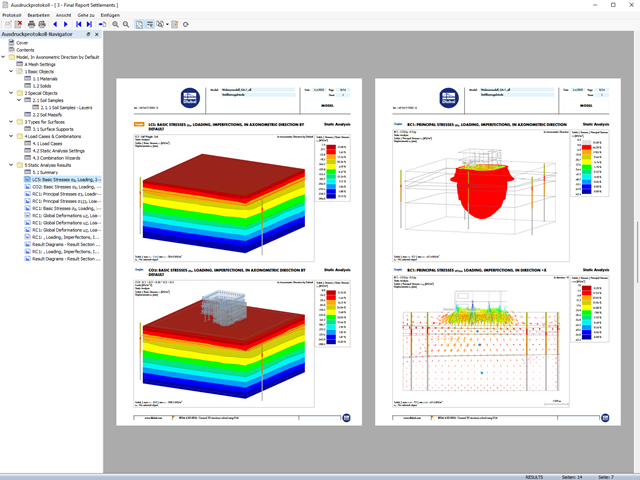
Your data are always documented in a multilingual printout report. You can adjust the content at any time and save it as a template. You can also add graphics, texts, MathML formulas, and PDF documents to your report with just a few clicks.
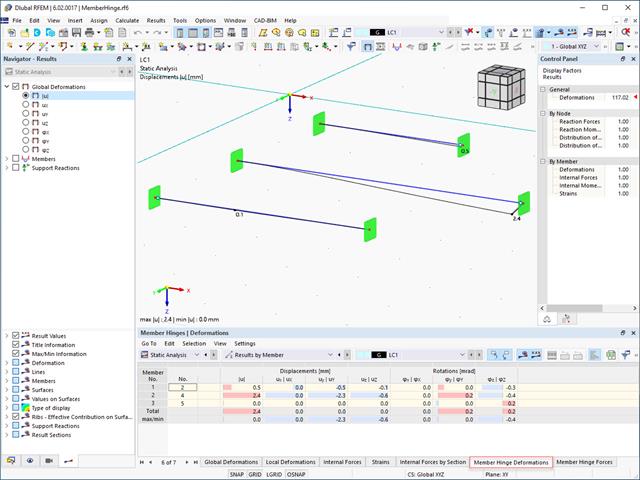
The results for members can be displayed graphically, using the Member Hinges navigator category. The numerical results of member hinges can be found in the Results by Member table category. The Member Hinge Deformations and Member Hinge Forces tables are available for the analysis and documentation of the deformation and force results in the area of member hinges.
The table lists the deformations and forces of each member for the locations specified in the Results Table Manager. There, you can also control which extreme values are displayed.
- Calculation of deflections and comparison with the normative or manually adjusted limit values
- Consideration of a precamber for the deflection analysis
- Different limit values are possible, depending on the design situation type
- Manual Adjustment of Reference Lengths and Segmentation by Direction
- Calculation of deflections related to the initial structure or to the deformed structure
- Further detailed design checks depending on the selected design standard (for example, vibration design according to EN 1999‑1‑1, 7.2.3)
- Graphical result display integrated in RFEM/RSTAB; for example, the design ratio of a limit value, or the deformation or the sag
- Complete integration of the results into the RFEM/RSTAB printout report
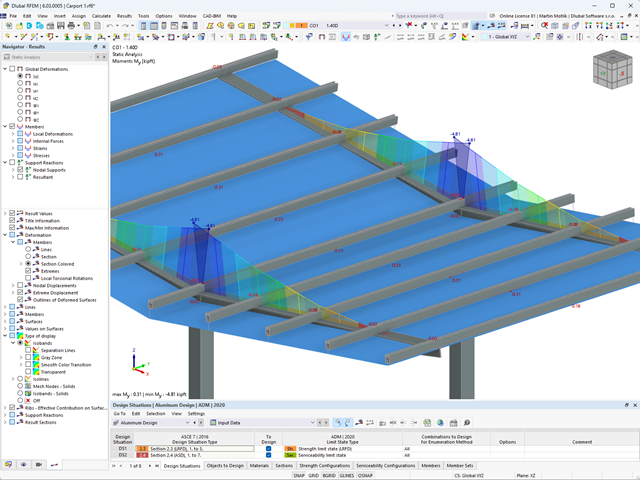
You can find the serviceability limit state design checks in the result tables of the Aluminum Design add-on. They are already fully integrated there. You have the option to display the design results with all the details at each location of the designed members. You can also use graphics with the result diagrams of the design ratios.
You can integrate all result tables and graphics into the global printout report of RFEM/RSTAB as a part of the aluminum design results. RFEM/RSTAB also allows you to display and document the deformations of the entire structure independently of the add-on.
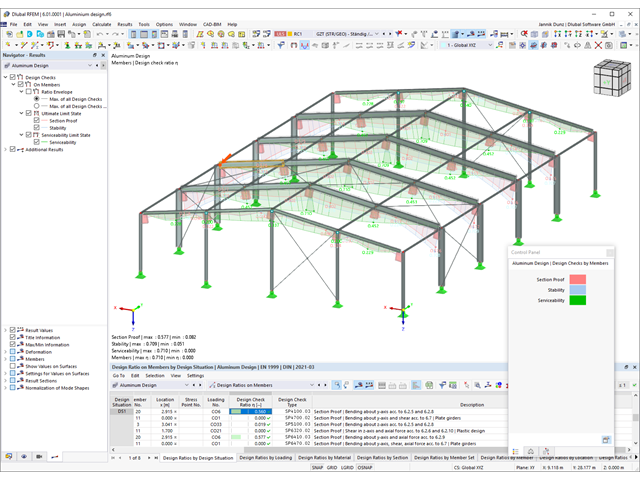
You can find the design checks displayed in tables in the Aluminum Design add-on. Moreover, you can display the distribution of the design ratios graphically. Extensive filter options are available for you both in the table as well as in the graphical output. You can thus specifically display the desired design checks by limit state or design type in the program.
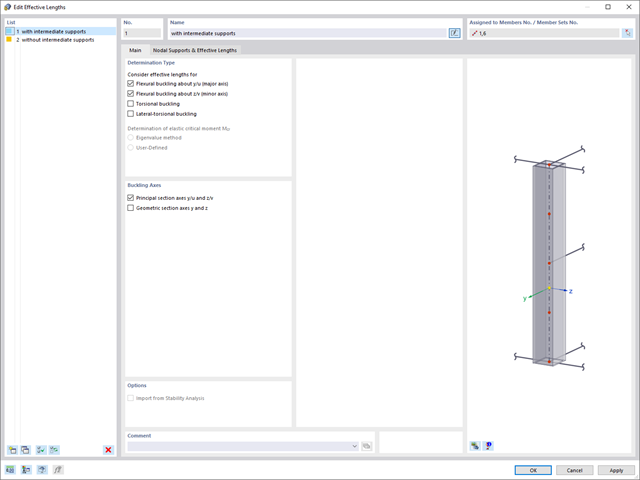
Note that the definition of the effective lengths in the Aluminum Design add-on is an essential requirement for the stability analysis. For this, define the nodal supports and effective length factors in the input dialog box. Do you want to clearly document the nodal supports and the resulting segments with the associated effective length factors? To check the input data, it is best for you to use the graphic display in the RFEM/RSTAB work window. Thus, you can comprehend the design at any time with minimum effort.
As usual, you enter the structural system and calculate the internal forces in the programs RFEM and RSTAB. You have unlimited access to the extensive material and cross-section libraries. Did you know that you can create general cross-sections using the RSECTION program? That saves you a lot of work.
Don't be afraid of additional windows and input chaos! Aluminum Design is completely integrated into the main programs and automatically takes into account the structure and the available calculation results. You can directly assign further entries for the aluminum design, such as effective lengths, cross-section reductions, or design parameters, to the objects to be designed. You can simply and efficiently select the elements graphically using the [Select] function.
Was your design successful? Very good, now comes the relaxed part. Because the program gives you the performed design checks in a table. You can display all result details in detail here. The clearly presented design formulas ensure that you will be able to understand the results without any problems. There is no black-box effect with Dlubal Software.
The design checks are carried out at all governing locations of the members and displayed graphically as a result diagram. You can find more detailed graphics in the result output. This includes the stress distribution on the cross-section or the governing mode shape, for example.
All input and result data are part of the RFEM/RSTAB printout report. You can select the report contents and extent specifically for the individual design checks.
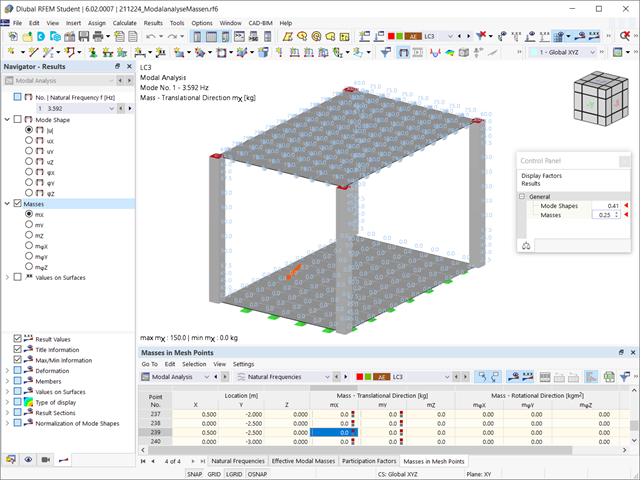
Have you already discovered the tabular and graphical output of masses in mesh points? That's right, this is also part of the modal analysis results in RFEM 6. This way, you can check the imported masses that depend on various settings of the modal analysis. They can be displayed in the Masses in Mesh Points tab of the Results table. The table provides you with an overview of the following results: Mass - Translational Direction (mX, mY, mZ), Mass - Rotational Direction (mφX, mφY, mφZ), and the Sum of Masses. Would it be best for you to have a graphical evaluation as quickly as possible? Then you can also graphically display the masses in mesh points.
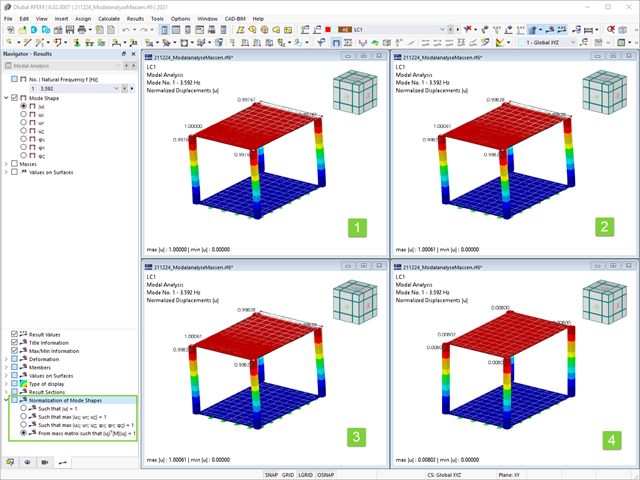
As you've already learned, the results of a Modal Analysis load case are displayed in the program after a successful calculation. You can thus immediately see the first mode shape graphically or as an animation. You can also easily adjust the representation of the mode shape standardization. Do that directly in the Results navigator, where you have one of four options for the visualization of the mode shapes available for the selection:
- Scaling the value of the mode shape vector uj to 1 (considers the translation components only)
- Selecting the maximum translational component of the eigenvector and setting it to 1
- Considering the entire eigenvector (including the rotation components), selecting the maximum, and setting it to 1
- Setting the modal mass mi for each mode shape to 1 kg
You can find a detailed explanation of the mode shape standardization in the OnlineManual here.
When performing a design according to EN 1993‑1‑3, it is possible to graphically display a mode shape for the distortional buckling of a cross-section, and for the RSECTION cross-sections.
The mode shape can also be output in RSECTION 1 for library cross-sections.
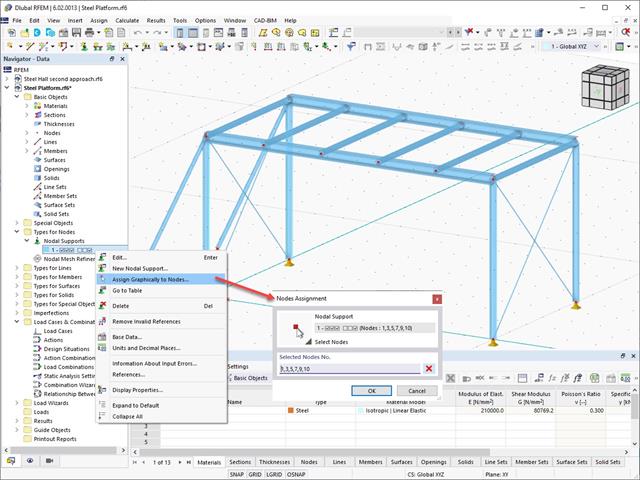
The object types listed below can be graphically assigned to the elements of the structure modeled in the program.
- Nodal supports
- Member shear panels
- Local reductions of member cross-sections
- Member transverse stiffeners
- Member longitudinal welds
- Effective lengths
- Boundary conditions
- Line supports
- Loads
- Member support
- Punching reinforcements
- Mesh refinements
- Surface reinforcements
- Surface results adjustments
- Surface support
- Service classes
- Imperfections
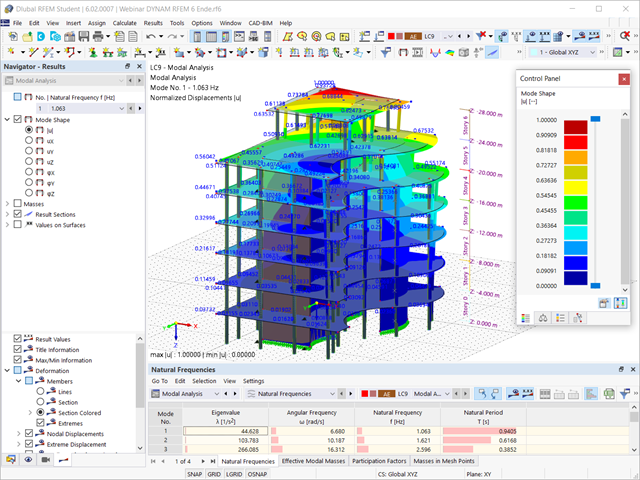
Is the calculation finished? The results of the modal analysis are then available both graphically and in tables. Display the result tables for the load case or the load cases of the modal analysis. Thus, you can see the eigenvalues, angular frequencies, natural frequencies, and natural periods of the structure at first glance. The effective modal masses, modal mass factors, and participation factors are also clearly displayed.
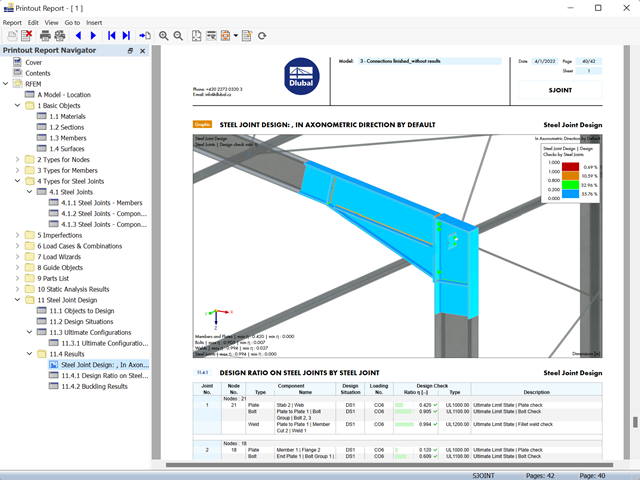
- The results of the connection design can be entered in the printout report
- When creating a new printout report, select the items added from the Steel Joints Add-on
- Use the tool 'Print Graphics to Printout Report' to insert graphics with the results of the connection, including the control panel, into the report
- Printout report contains the specifications of the connection components, design parameters, results and graphics

- A wide range of cross-sections, such as rectangular sections, square sections, T‑sections, circular sections, built-up cross-sections, irregular parametric cross-sections, and many others (suitability for design depends on the selected standard)
- Design of cross-laminated timber (CLT)
- Design of timber-based materials and laminated veneer lumber according to EC 5
- Design of tapered and curved members (design method according to the standard)
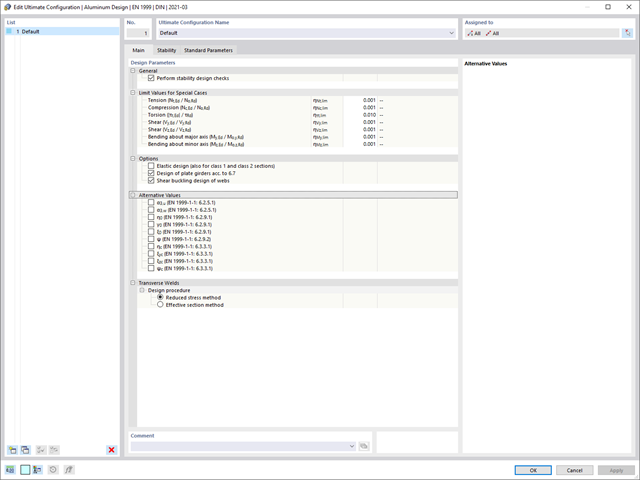
- Adjustment of the essential design factors and standard parameters is possible
- Flexibility due to detailed setting options for basis and extent of calculations
- Fast and clear results output for an immediate overview of the result distribution after the design
- Detailed output of the design results and essential formulas (comprehensible and verifiable result path)
- Numerical results clearly arranged in tables and graphical display of the results in the model
- Integration of the output into the RFEM/RSTAB printout report
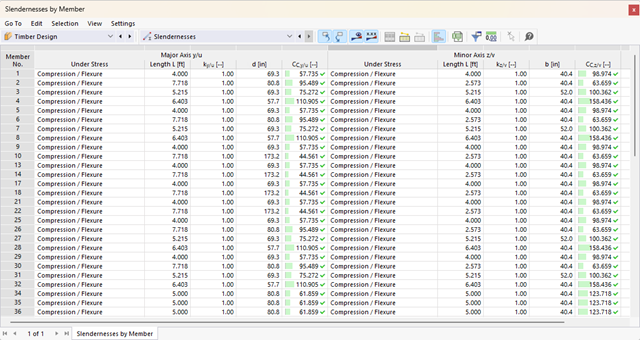
- Stability analyses for flexural buckling, torsional buckling, and flexural-torsional buckling under compression
- Import of the effective lengths from the calculation using the Structure Stability add-on
- Graphical input and check of the defined nodal supports and effective lengths for stability analysis
- Determination of the equivalent member lengths for tapered members
- Consideration of Lateral-Torsional Bracing Position
- Lateral-torsional buckling analysis of the structural components subjected to moment loading
- Depending on the standard, a choice between user-defined input of Mcr, analytical method from the standard, and use of internal eigenvalue solver
- Consideration of a shear panel and a rotational restraint when using the eigenvalue solver
- Graphical display of a mode shape if the eigenvalue solver was used
- Stability analysis of structural components with the combined compression and bending stress, depending on the design standard
- Comprehensible calculation of all necessary coefficients, such as the factors for considering moment distribution or interaction factors
- Alternative consideration of all effects for the stability analysis when determining internal forces in RFEM/RSTAB (second-order analysis, imperfections, stiffness reduction, possibly in combination with the Torsional Warping (7 DOF) add-on)