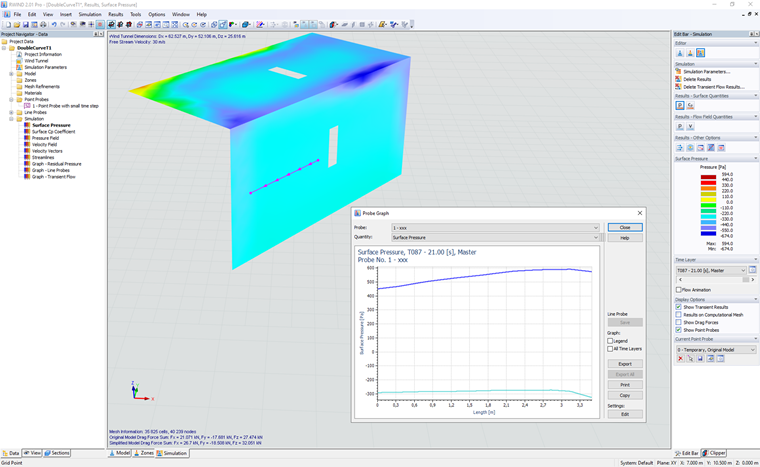
The "Graph Along Line" function enables you to define a line on the model or in the slicer plane, and thus create a sectional diagram of the results along the line. The "M05_Golf" model in the "Demo" project group, for example, includes some line probes for the flow field results of a car model.
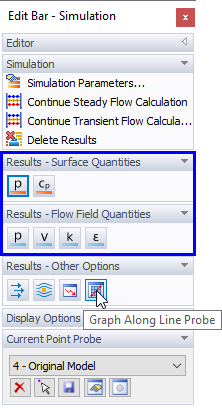
To create a line graph, use the "Graph Along Line Probe" button
![]() that is available in the Results section of the panel. Note that this function is only applicable to the surface and flow field quantities.
that is available in the Results section of the panel. Note that this function is only applicable to the surface and flow field quantities.
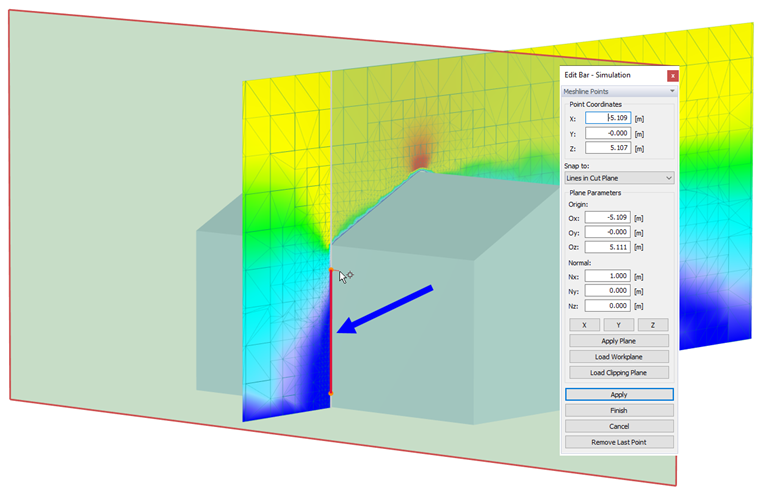
Once the function has been activated, you can select the relevant points of the line (or polyline) by clicking the mouse. The coordinates of the points are displayed in the panel that has a specific layout for this purpose. There, you can also modify the object snap, if necessary. When you have selected two (or more) points of the line, click
![]() .
.
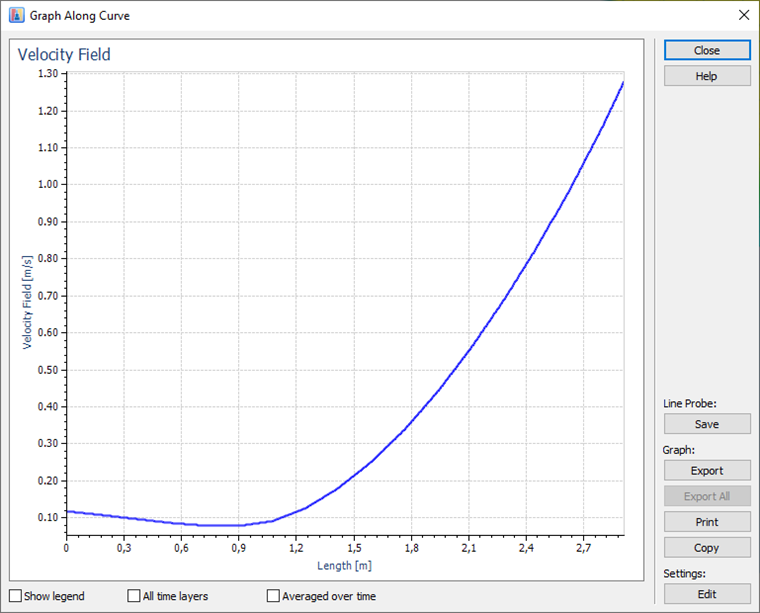
The "Graph Along Curve" dialog box appears.
To define this diagram as New Line Probe, use the
![]() button. Another dialog box appears where you can enter the "Name" of the probe and check the coordinates of each point.
button. Another dialog box appears where you can enter the "Name" of the probe and check the coordinates of each point.
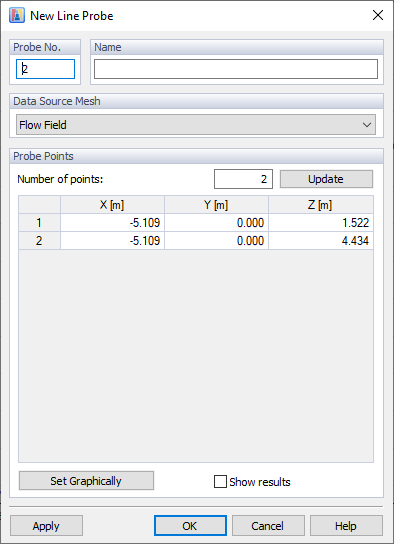
The options of the "Data Source Mesh" section control to which type of mesh the probes refer. "Line" probes are specific to the finite volume mesh of either the flow field (for flow field quantities) or the simplified model (for surface quantities), see Chapter Probes.
All user-defined line probes are listed in the "Data" navigator. Use the shortcut menu of a line probe, which is available in both the navigator and the graphics, to display the diagram and to modify or delete an item.
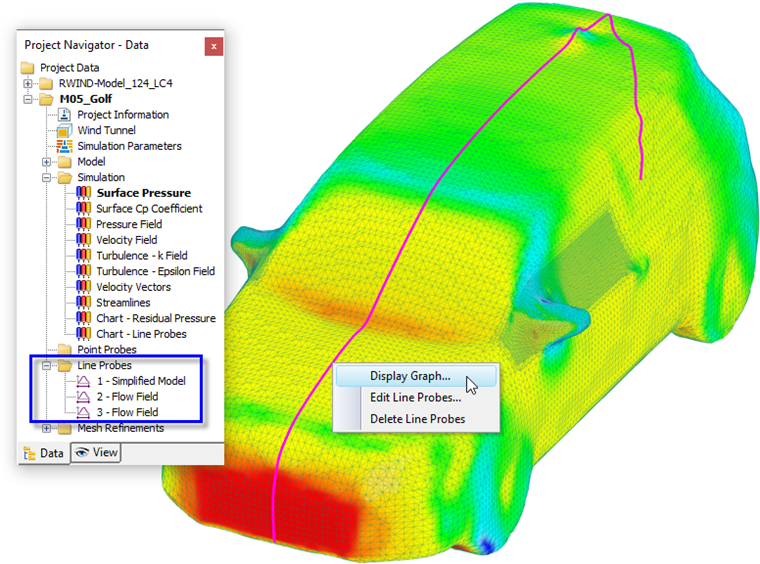
The results of every line probe are saved by points along the line. Note that they will not be used for the documentation of results in the printout report of RFEM 6 or RSTAB 9.
Front and Back Values Along Curves
There is the option to display the distribution of quantities along the curves or line probes placed on the original model. This was not previously possible (RWIND 1.x) due to the risk of double values (front and back) on some models (for example, on a thin vertical plate with zero thickness). This problem has been solved by showing two curves in the graph in such cases, one for the values on the front side and the other for the values on the back side of the model. For more information about the front and back values, see the following chapter Sections, Mesh Section Information .