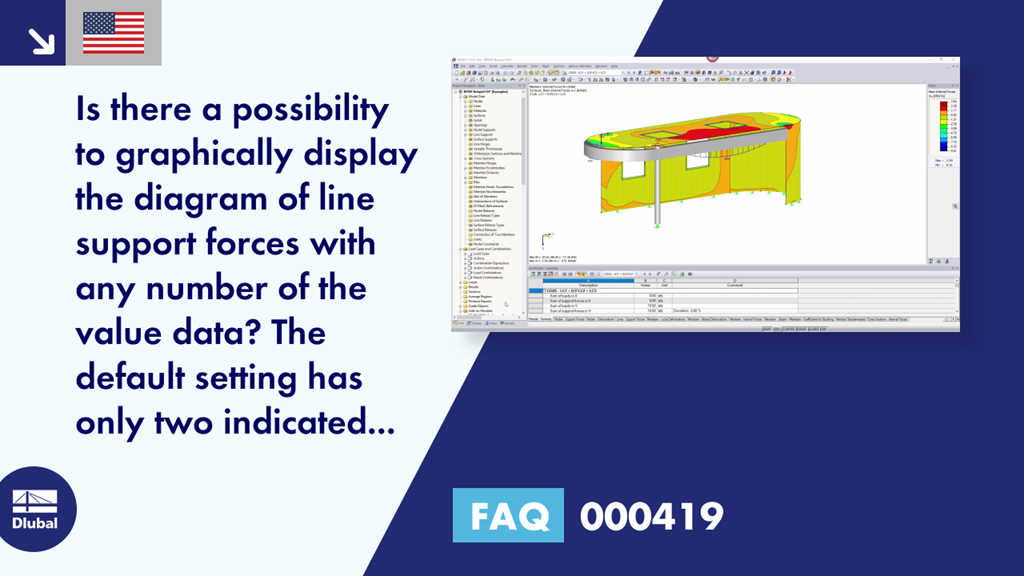
Question:
Is there a possibility to graphically display the diagram of line support forces with any number of the value data?
The default setting has only two indicated values.
Answer:
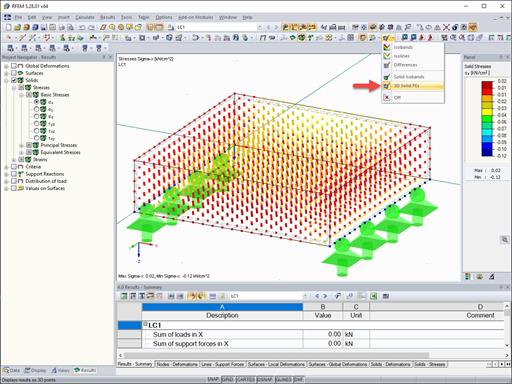
By default, only two values (max and min) are displayed on the result diagram of the line supports.
However, you can also use the "Display" navigator to display all values:
"Results" → "Support Reactions" → "Actual" → "All Values"
The distribution depends on the FE mesh, whereby one value is displayed on each FE node.
For example, you can influence the distribution on specific surfaces or lines using an FE mesh refinement. The numerical output in the result table and thus also in the printout report is only controlled by the global FE mesh.


![Reduction of Building to Cantilever Structure: The individual mass points represent the floors. The deflection due to the normal compression forces shown in (a) is (b) converted into equivalent moments of displacement or shear forces [2].](/en/webimage/009762/2420261/01-en-png-12-png.png?mw=350&hash=dd36dc43123116724231958668ad6cdcb13a0169)


.png?mw=512&hash=ea9bf0ab53a4fb0da5c4ed81d32d53360ab2820c)


.jpg?mw=350&hash=8f312d6c75a747d88bf9d0f5b1038595900b96c1)
