Answer:
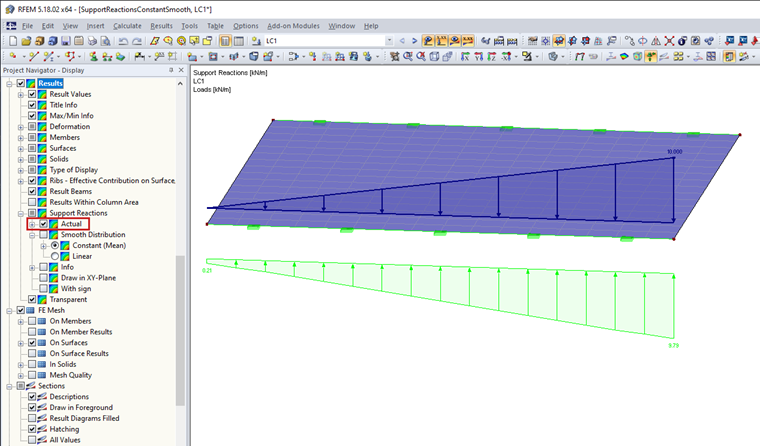
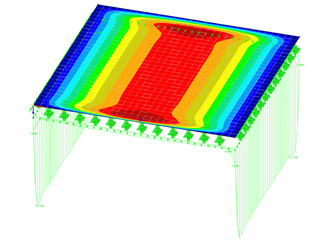
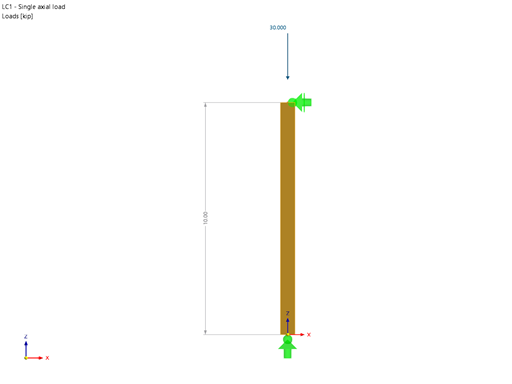
The easiest way to explain the function is to use an example. The example file can be downloaded under "Downloads" at the end of this FAQ.- In Load Case 1, the following support reaction results for the "Actual" distribution:
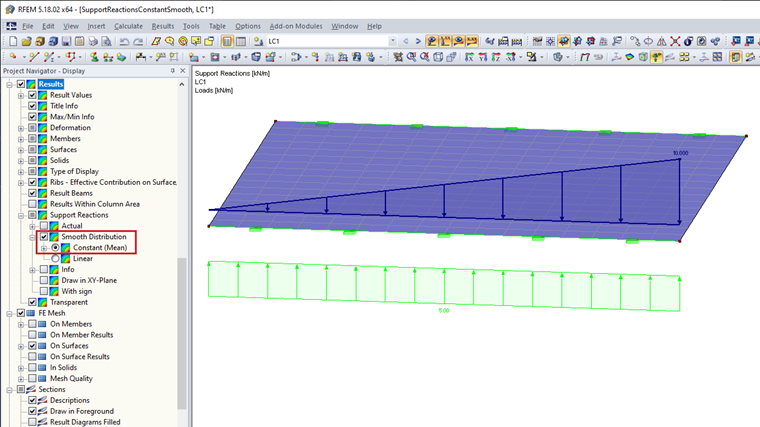
- Also in Load Case 1, the following distribution results for "Smooth Distribution" (constant):
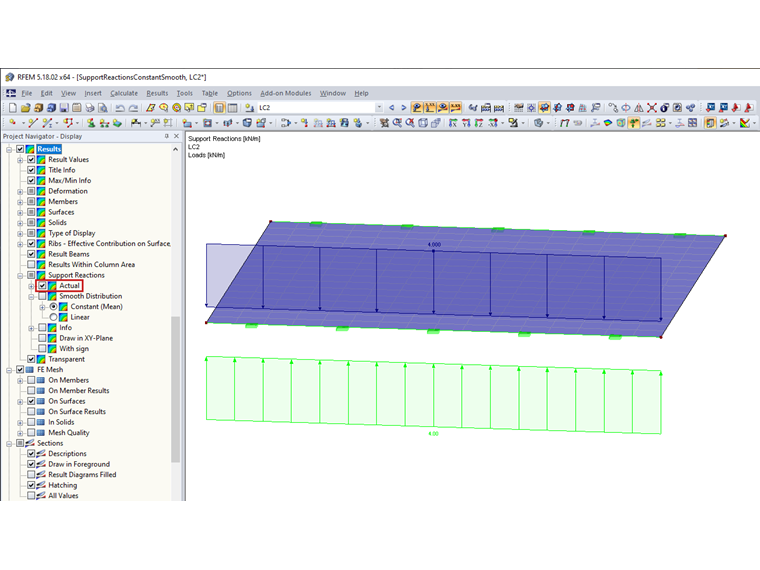
- In Load Case 2, the following distribution results for "Actual":

RC 1 = LC1/s or LC2/s
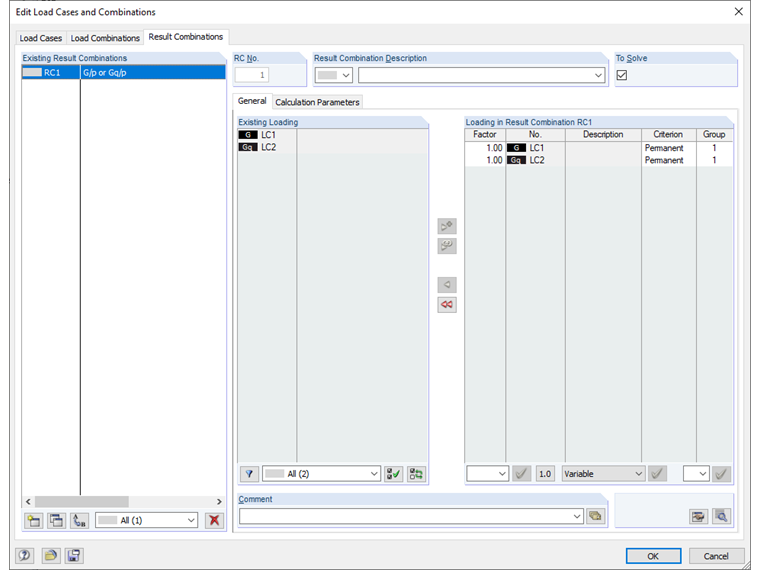
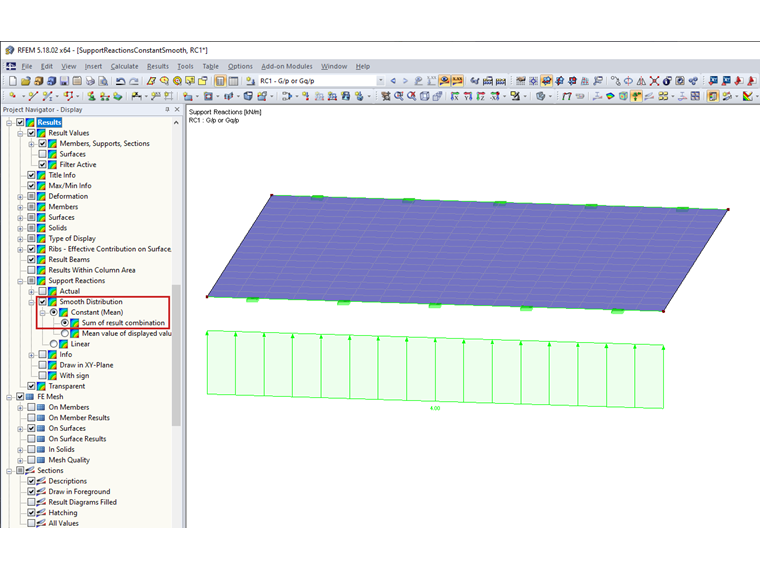
If you now look at the "Sum of result combinations" setting, you get the following distribution for RC1:
LC1 ... smoothed value = 5 kN/m ... here the max value of RC1
LC2 ... smoothed value = 4 kN/m ... here the min value of RC1
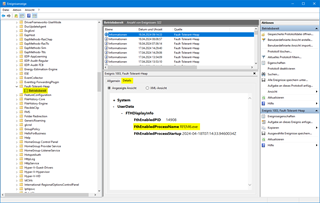
Now, we switch to the max value of RC1 and the actual distribution of the support reactions in the Results navigator:
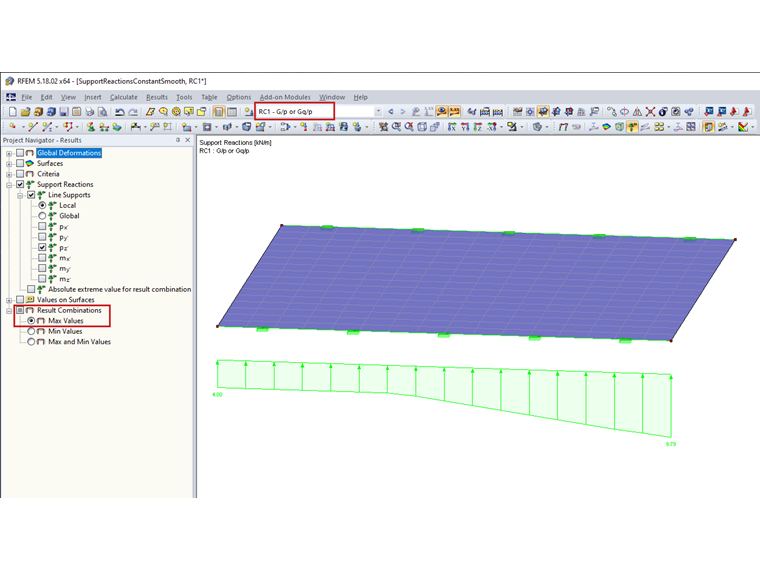
The mean value of the values shown in the previous image is no longer 5.0 kN/m, but 5.80 kN/m.
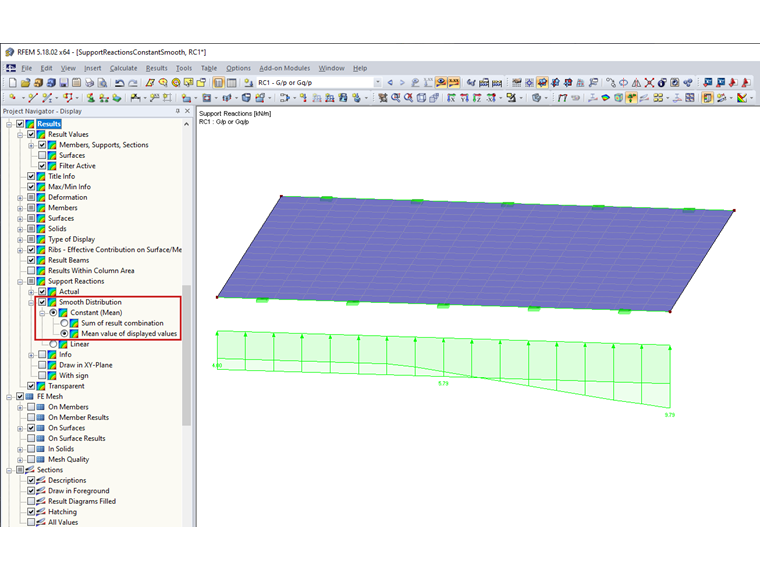
If you now evaluate the min value of RC1 with the "Mean value of displayed values" option, the result is a value of 3.2 kN/m instead of the 4.0 kN/m described above.
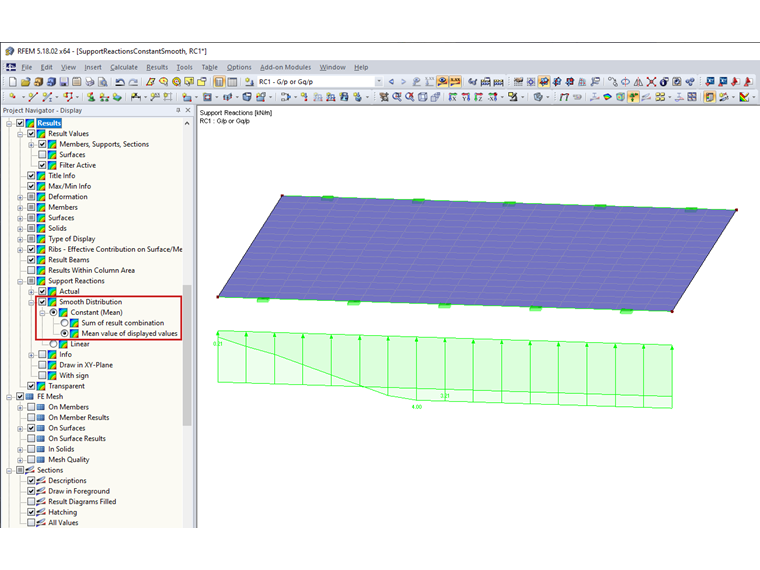
Thus, the setting in the Display navigator has an influence on averaging the results from the additive RCs.


.png?mw=512&hash=4e74affa9ad0c7b703151c5085ac9b8e59171c23)


.jpg?mw=350&hash=8f312d6c75a747d88bf9d0f5b1038595900b96c1)


.png?mw=600&hash=49b6a289915d28aa461360f7308b092631b1446e)