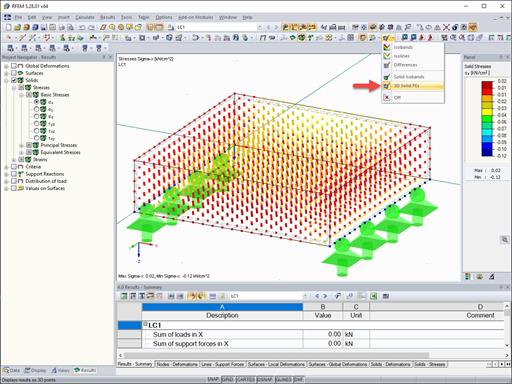
Now, you can define which of the surrounding result values are needed to display them as extremes. You can also enter the influence range of the examination of values.
The upper part of the graphic shows result jumps of 50% (2.63 cm2/m) in the range of three elements. This explains the myriad reinforcement data at the edges of the yellow area. However, if you want to obtain the values of the dark yellow areas, you need to increase the influence range. The result is shown in the lower part of the graphic.


.png?mw=512&hash=ea9bf0ab53a4fb0da5c4ed81d32d53360ab2820c)


.jpg?mw=350&hash=8f312d6c75a747d88bf9d0f5b1038595900b96c1)
