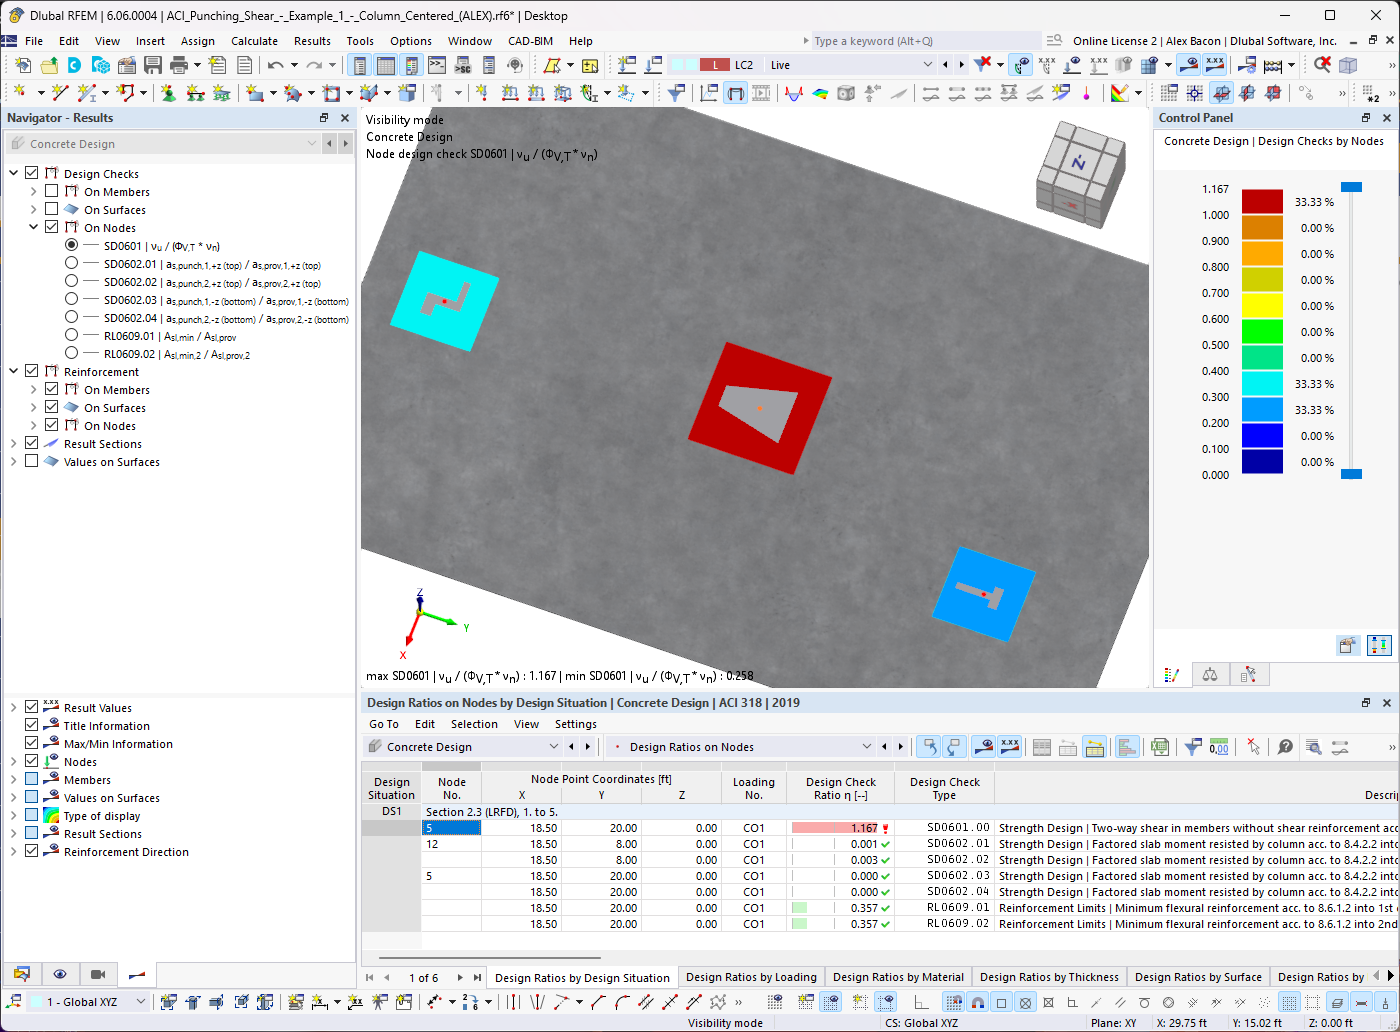
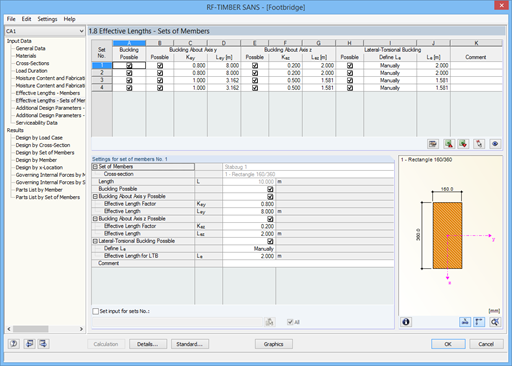
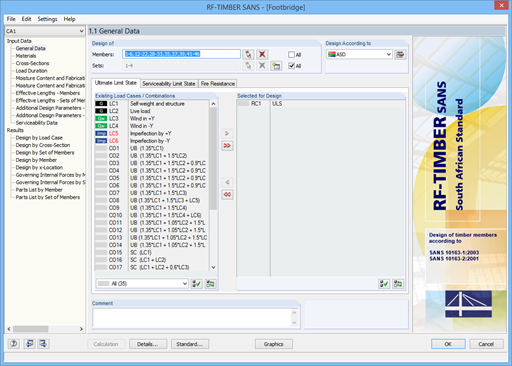
After the calculation, the module displays results in clearly arranged result tables. All intermediate values (for example, governing internal forces, adjustment factors, and so on) can be included in order to make the design more transparent. The results are listed by load case, cross-section, member, and set of members.
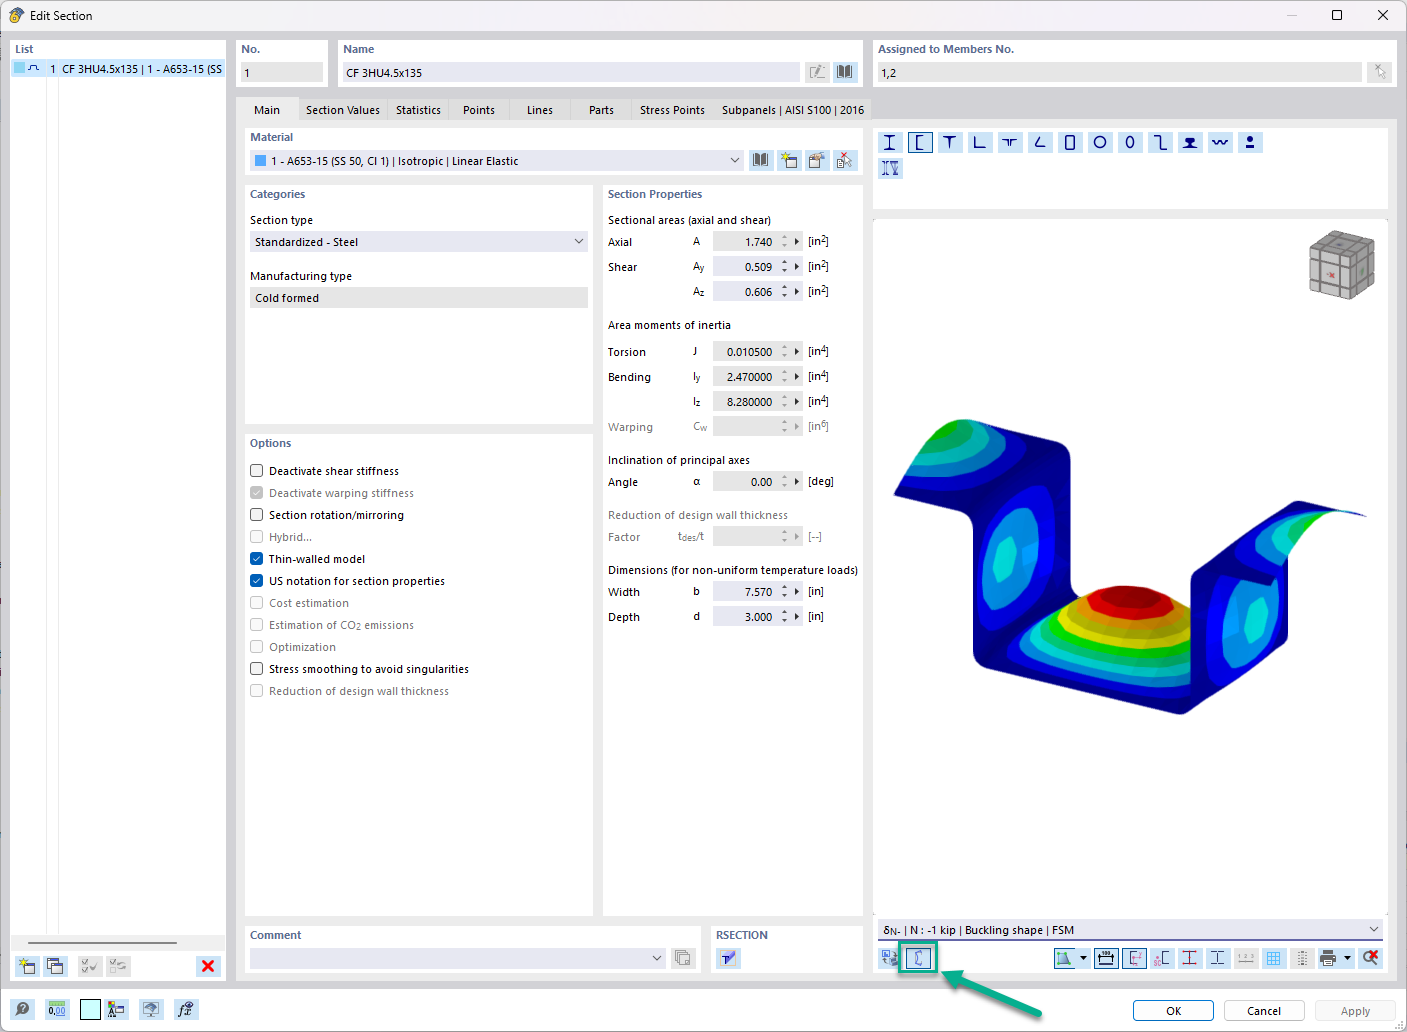
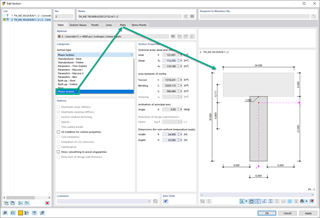
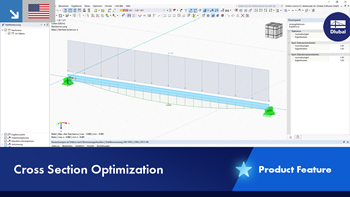
If the analysis fails, the relevant cross-sections can be modified in an optimization process. It is also possible to transfer the optimized cross-sections to RFEM/RSTAB to perform a new calculation.
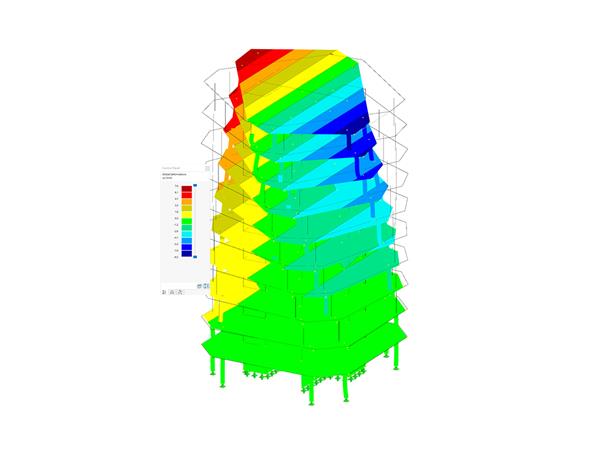
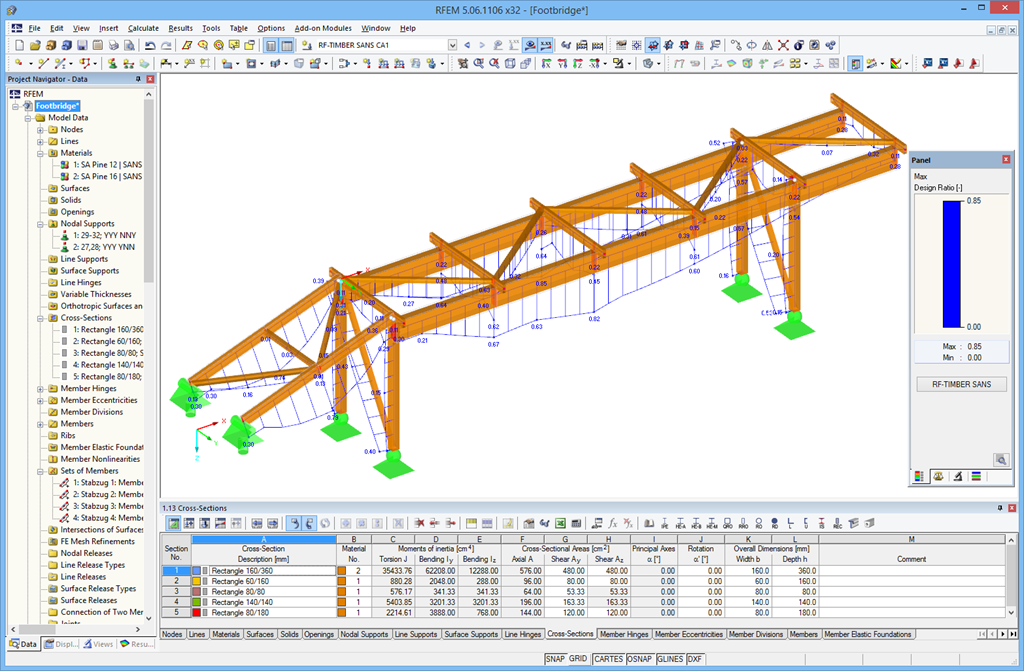
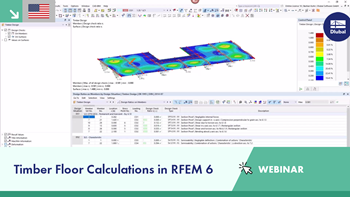
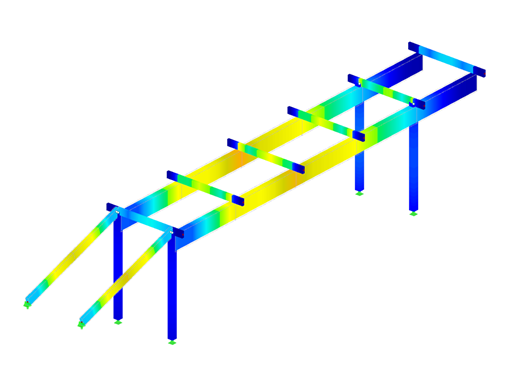
The design ratio is represented with different colors in the RFEM/RSTAB model. This way, you can quickly recognize critical or oversized areas of the cross-section. Furthermore, result diagrams displayed on the member or set of members ensure targeted evaluation.
In addition to the input and result data, including design details displayed in tables, you can add all graphics into the printout report. This way, comprehensible and clearly arranged documentation is guaranteed. You can select the report contents and extent specifically for the individual designs.


.jpg?mw=350&hash=8f312d6c75a747d88bf9d0f5b1038595900b96c1)