


2024-05-30
026987
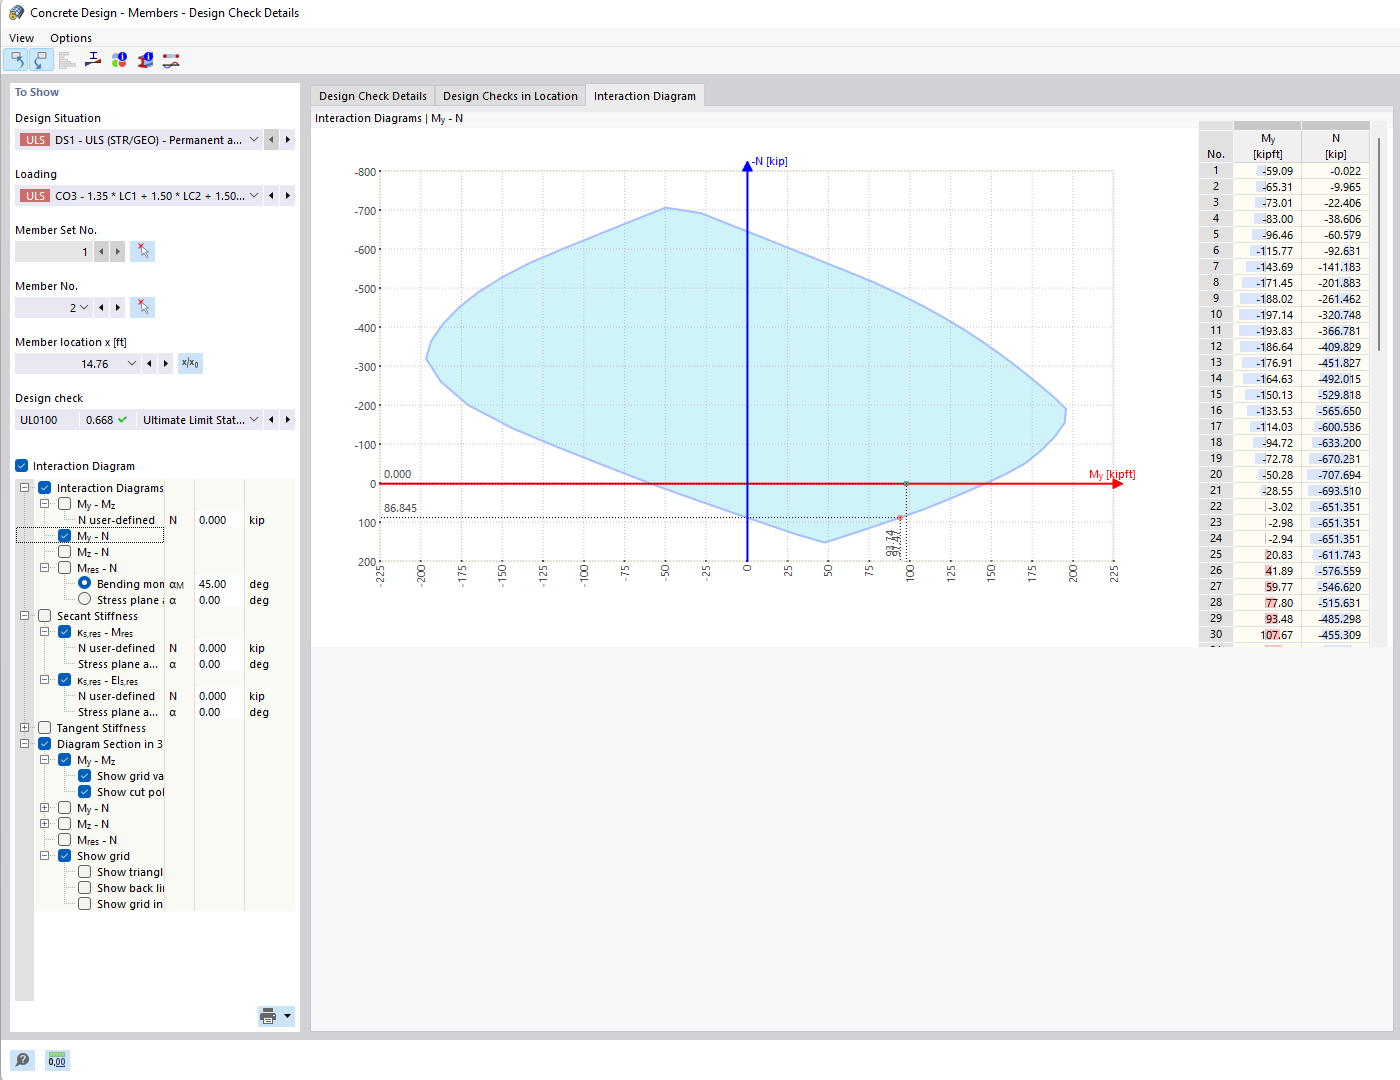
Diagram of Moment-Axial Force Interaction
Display of the moment-axial force interaction diagram to analyze the load-bearing capacity of reinforced concrete cross-sections.
The image shows a moment-axial force interaction diagram, which graphically displays the relationships between bending moments and axial forces in reinforced concrete cross-sections. It allows for the analysis of the cross-section's load-bearing capacity through graphical output, supported by dynamically linked tables that represent limit load-bearing capacity points. The diagram can be created with the axes of the cross-sections or an individual moment vector to generate an Mres-N diagram. Additional 3D displays allow for advanced analysis of the section properties.
2025-03-24
026988
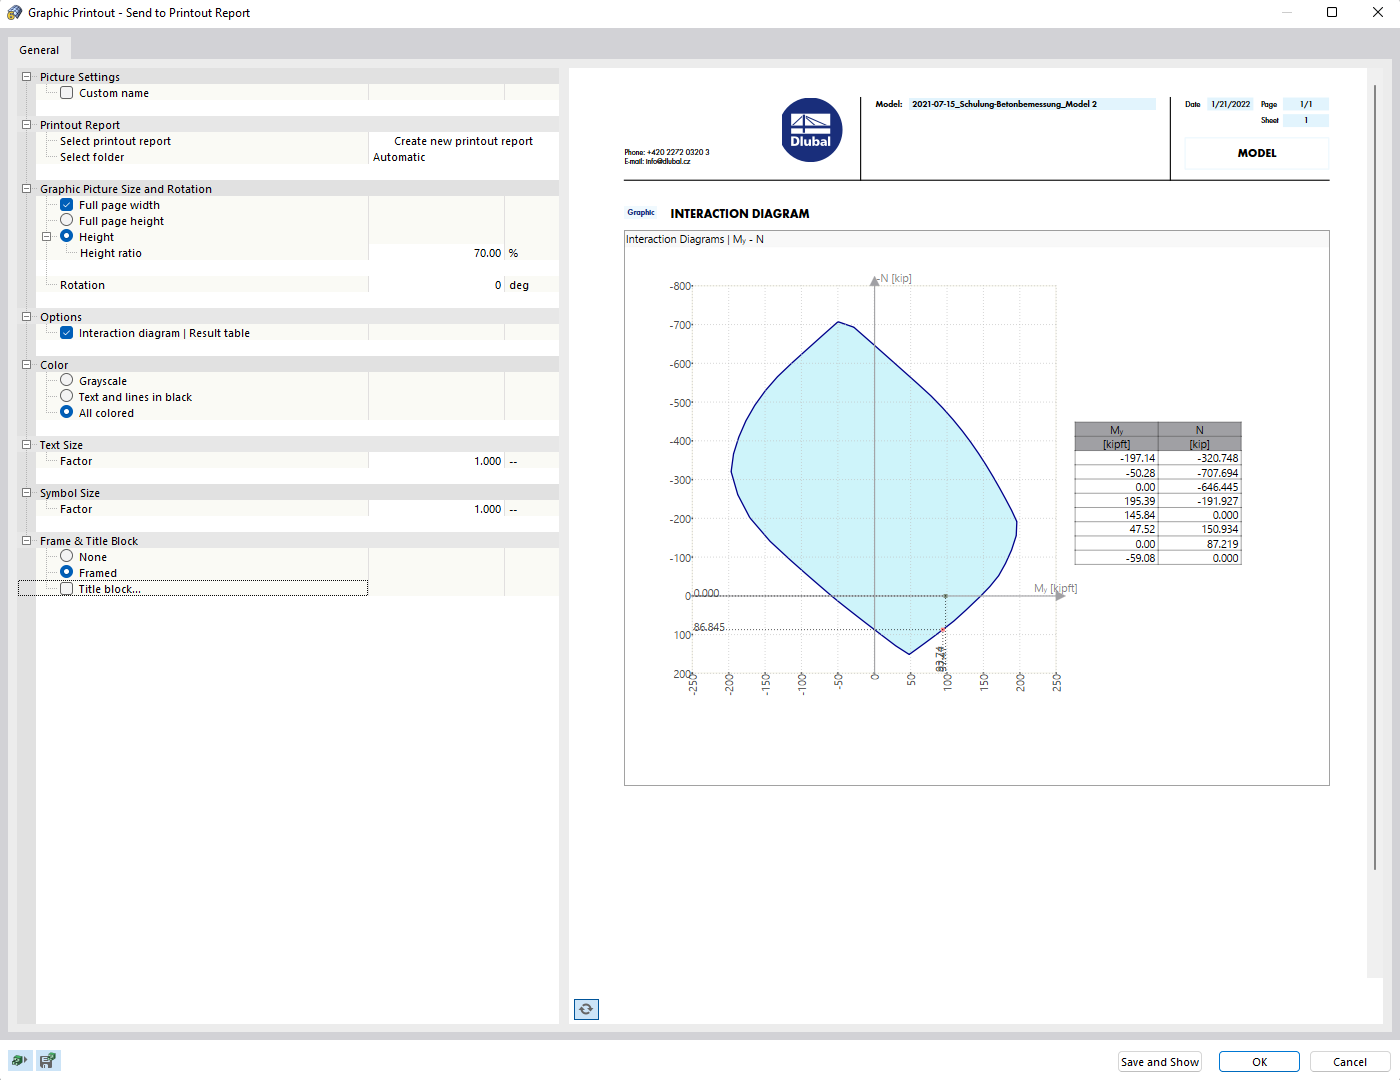
Printing Interaction Diagram into Printout Report
Interaction diagram from a building plan visualized in a printout report.
The image shows an interaction diagram embedded in a printout report. It illustrates the way in which static and dynamic calculations are presented in structural engineering. Such a diagram is crucial for visualizing load capacities and resistance in structural analysis. The application presented in the video shows how to comprehensively document and analyze complex structures.
2025-03-24
026989
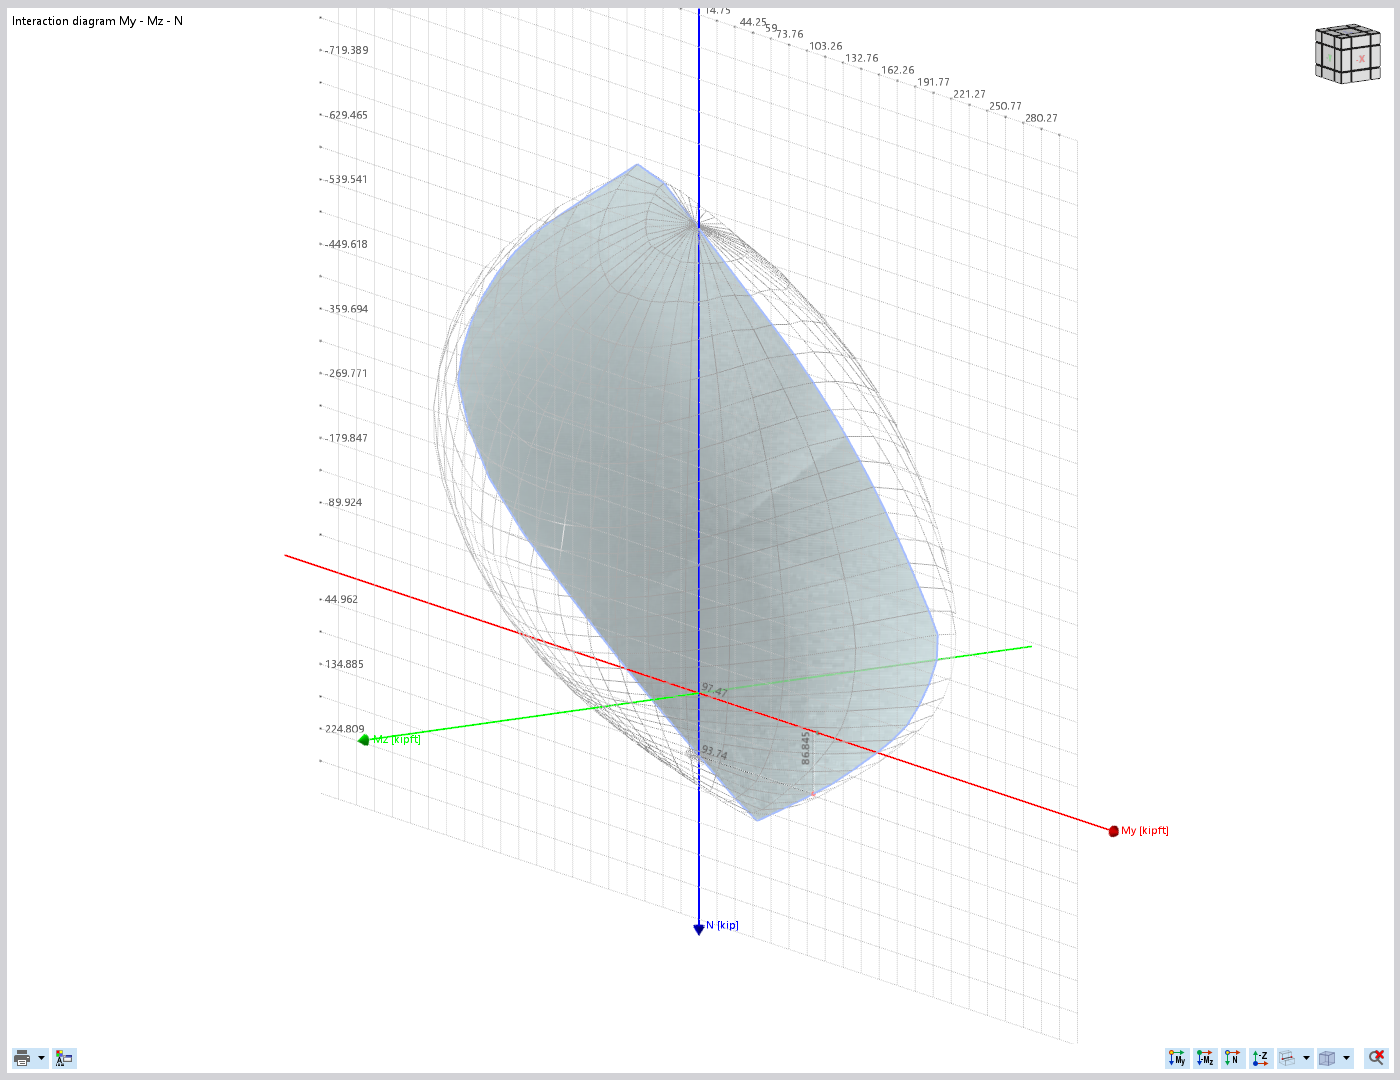
Section Plane for My-N Diagram in My-Mz-N Interaction Diagram
The My-N diagram shows the interaction of moments and axial force in the structural analysis model.
The My-N diagram in the My-Mz-N interaction diagram shows the relationship between bending moments and axial force. Such diagrams are used to analyze the load capacity of structures. The visualization provides insights into the performance limits under different load combinations.