
2026-02-23
031872
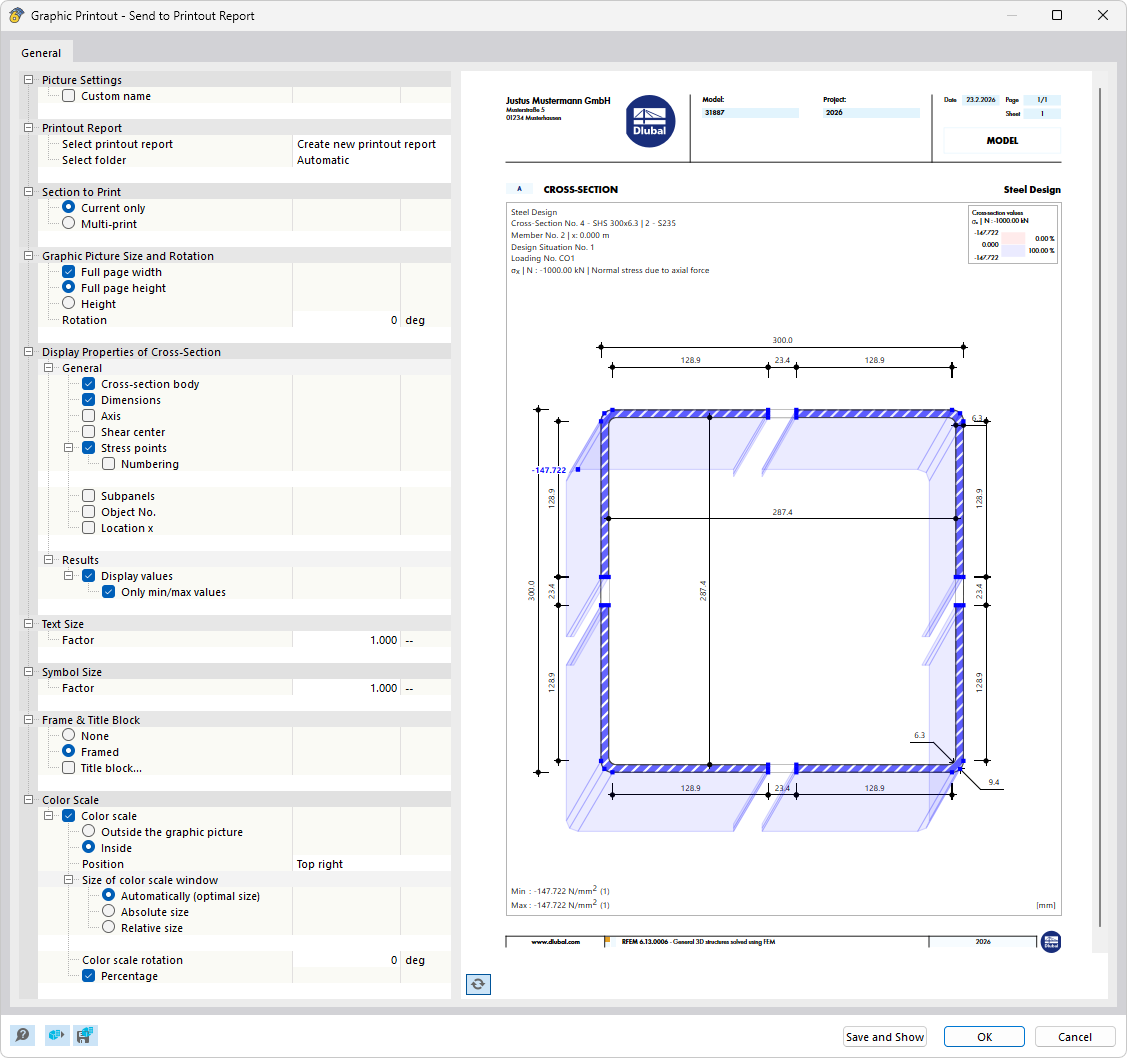
Printing Result Diagrams in Printout Report
The image shows a graphical display of result diagrams in a cross-section of a model. This visualization allows for the precise analysis of the trends of the calculated results. The graphic serves as the basis for the graphical expression in a printout report.