


2022-12-14
036498
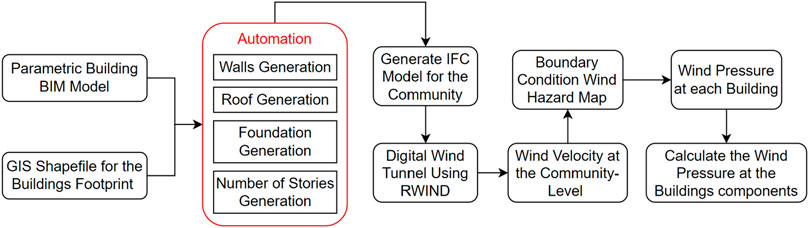
Schematic Flowchart for Developed Approach to Integrate BIM and GIS Models for Wind Damage Analysis
2024-11-20
036499
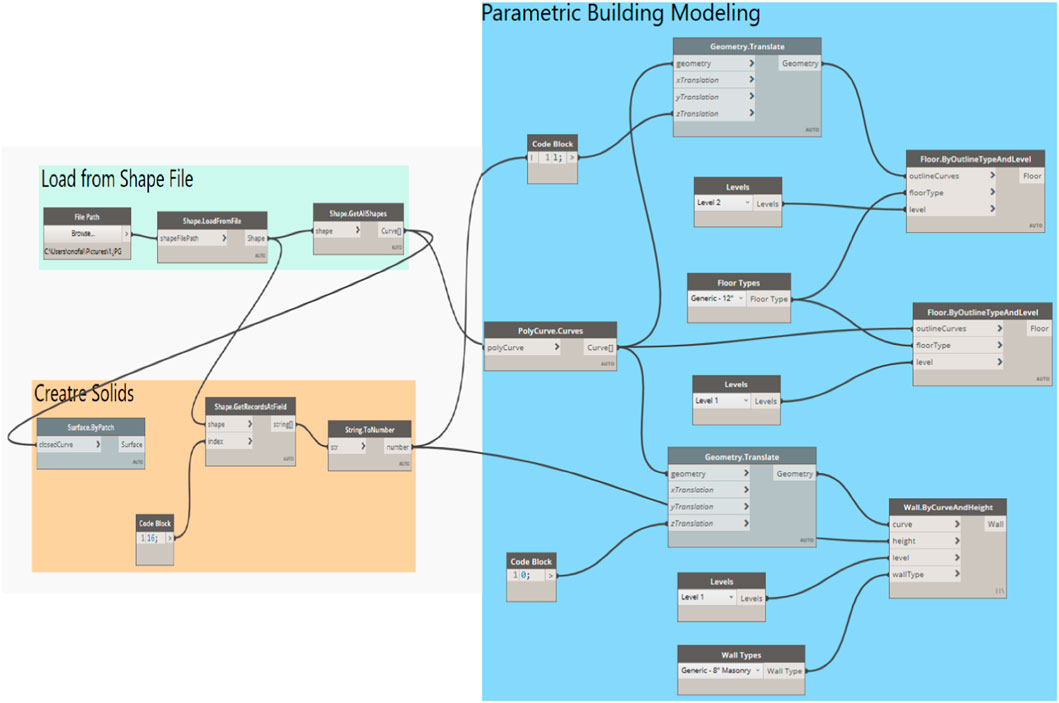
Logic Behind Developed Algorithm in Terms of Revit Dynamo to Link Between GIS Shapefile and Parametric BIM Model
2024-11-20
036500
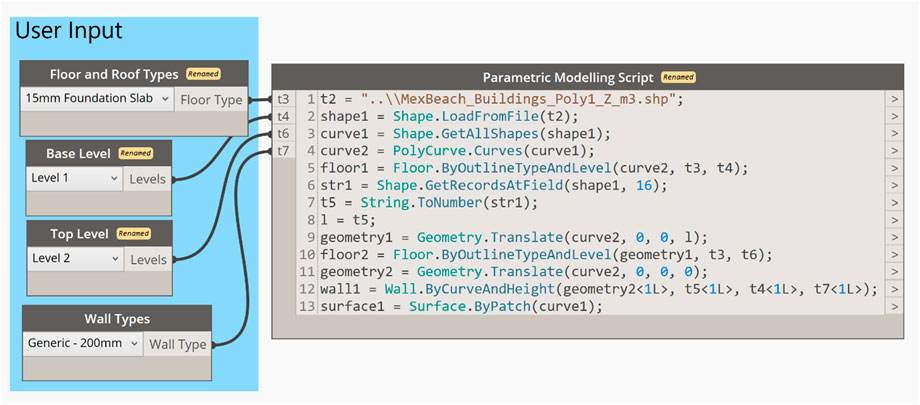
Parametric BIM Modeling Python Algorithm to Convert 2D Building Footprint to 3D Solid Building
2024-11-20
036501
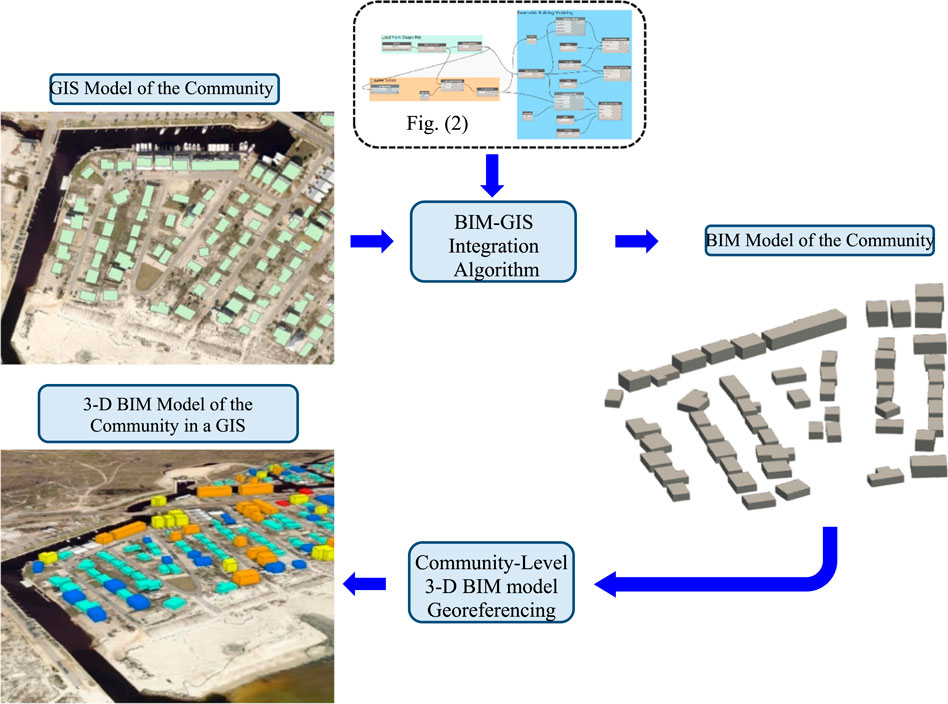
Schematic Workflow to Transform 2-D GIS Community Model to 3-D Integrated BIM-GIS Model of Community
2024-11-20
036502
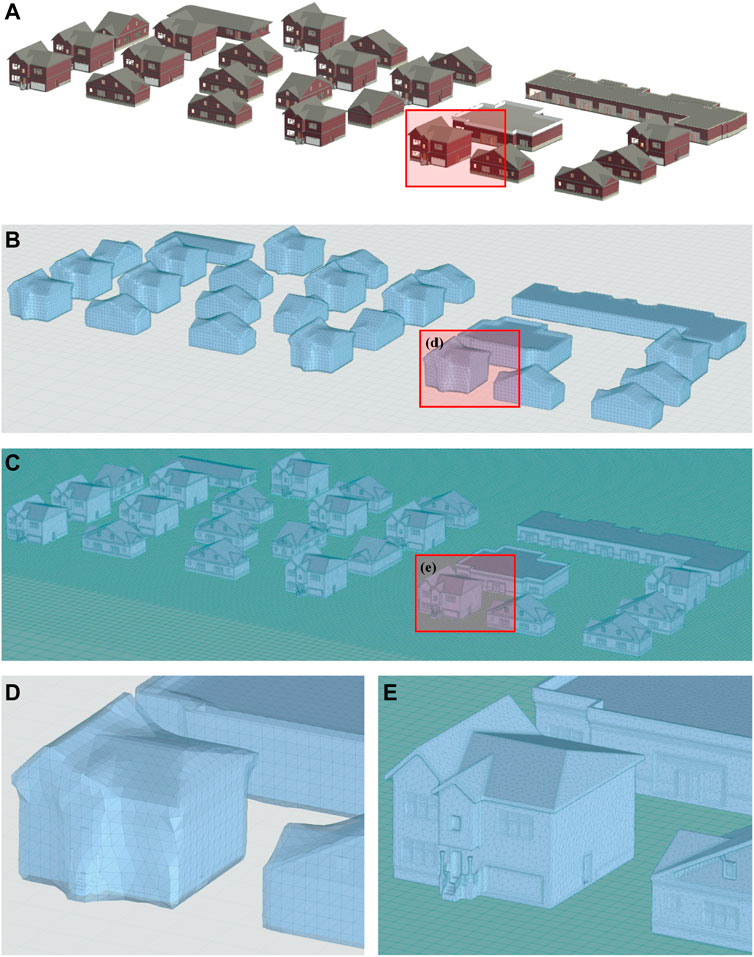
Community-Level Geometry Generation for Buildings: (A) BIM Model of Community; (B) Low-Resolution Geometry; (C) High-Resolution Geometry; (D–E) Close-up Views on Buildings Showing Size of Mesh Used to Generate Geometry
2024-11-20
036503
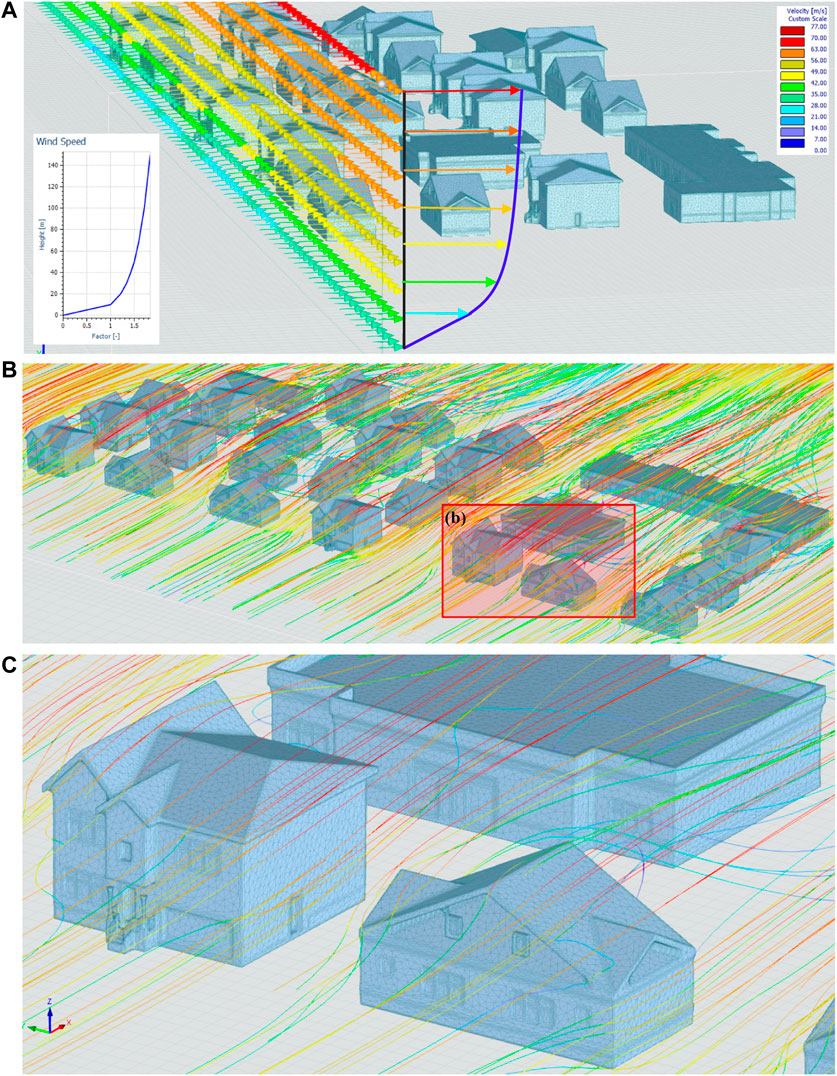
Modeled Digital Wind Tunnel Along with Resulted Wind Flow Across Community: (A) Digital Wind Tunnel Setting; (B) Wind Flow Across Community; (C) Close-up View on Modeled Wind Flow
2024-11-20
036504
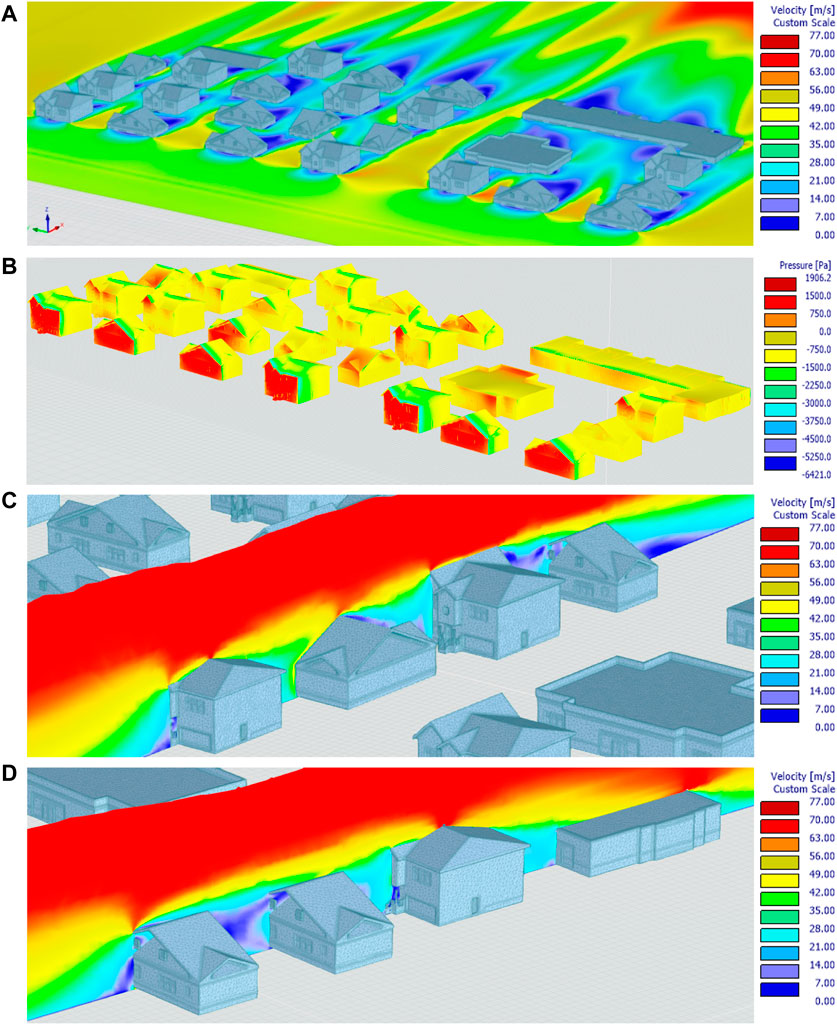
Spatial Variation of Wind Speed and Wind Pressure at Community-Level: (A) Wind Speed Contour Across Community; (B) Wind Pressure on Buildings; (C) Wind Profile One Across Buildings; (D) Wind Profile Two Across Buildings
2024-11-20
036505
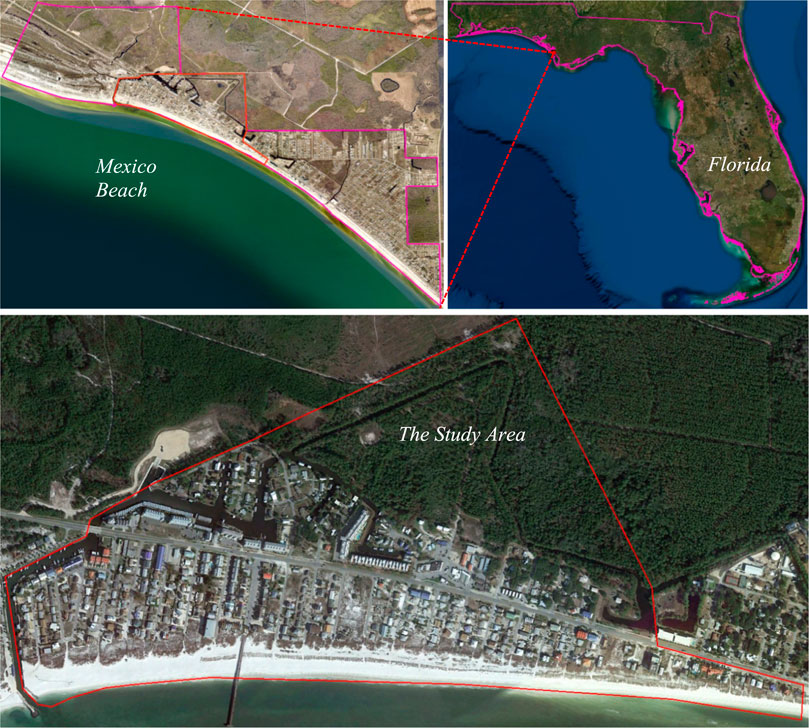
Geographical Location of Mexico Beach with Respect to State of Florida with Close-up View on Chosen Study Area Within Mexico Beach, FL
2024-11-20
036506
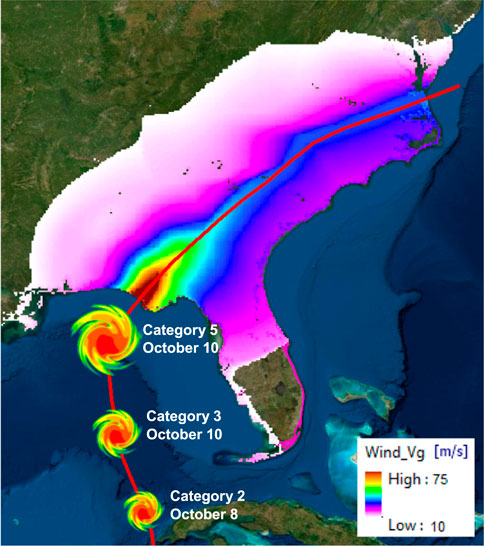
Evolution of Hurricane Michael in the Gulf of Mexico and Its Landfall on the US Along with Spatial Variation of Wind Speed Across Southeast of the US
2024-11-20
036507
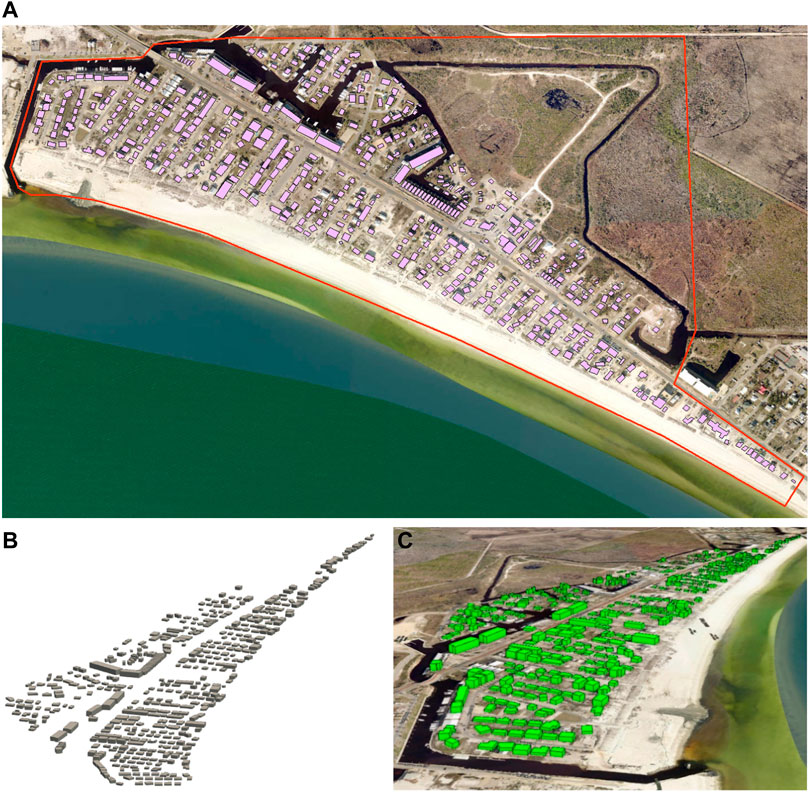
Building Footprint for Study Area in Mexico Beach, FL Along with New BIM and GIS Model: (A) Footprint for Buildings Within Study Area; (B) BIM Model for Community; (C) BIM Model of Community Georeferenced in 3-D GIS Environment
2022-12-14
036508
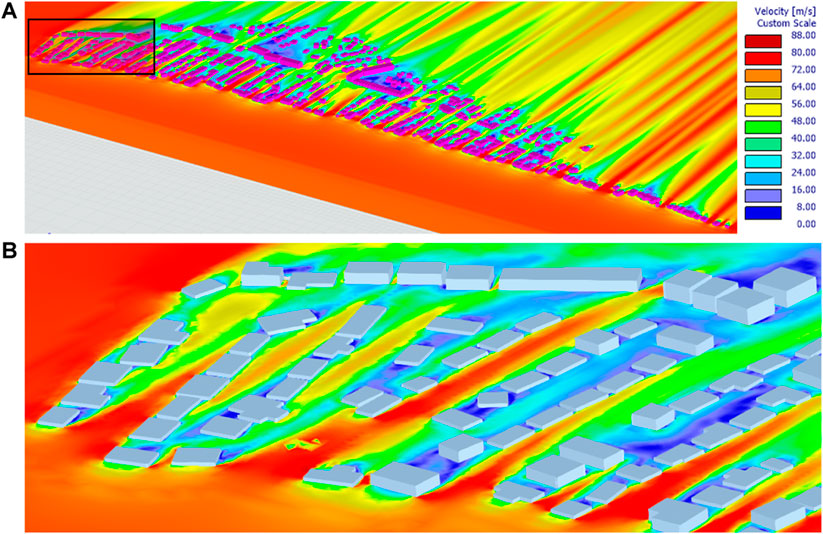
Modeled Wind Flow for Study Area: (A) Spatial Distribution of Wind Speed Across Community; (B) Close-up View on Wind Speed Contours
2024-11-20
036509
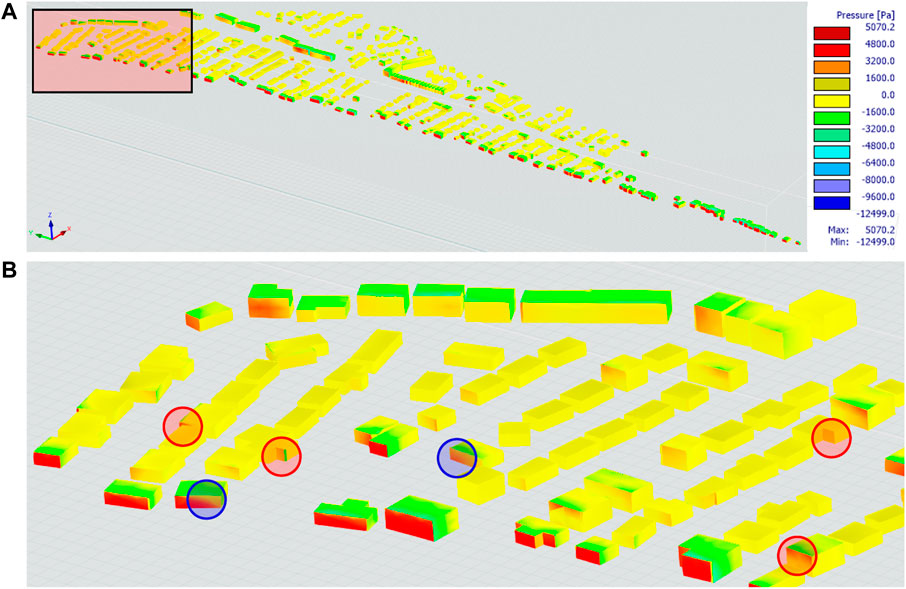
Wind Pressure Distribution: (A) Distribution of Surface Wind Pressure on Buildings Across Community; (B) Close-up View on Building-Level Wind Press Distribution
2024-11-20
036510
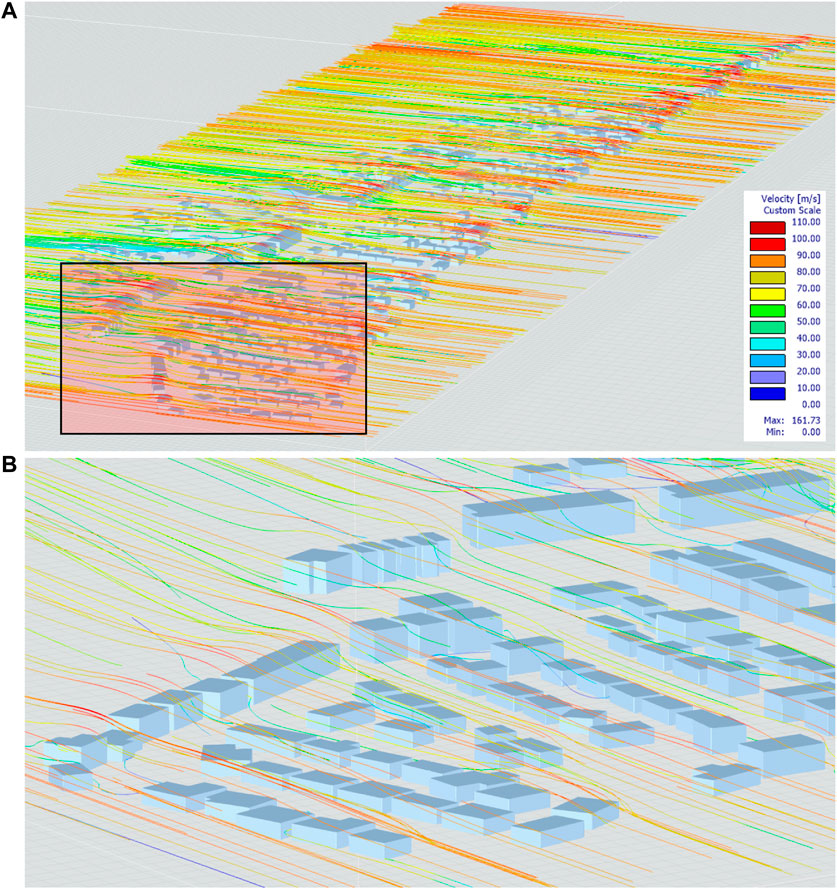
Wind Flow Analysis Results: (A) Wind Flow Lines Across Community Color-Coded Based on Variation of Their Wind Speed; (B) Close-up View on Variation in Wind Flow and Wind Speed