2024-11-20
036510
RFEM 6
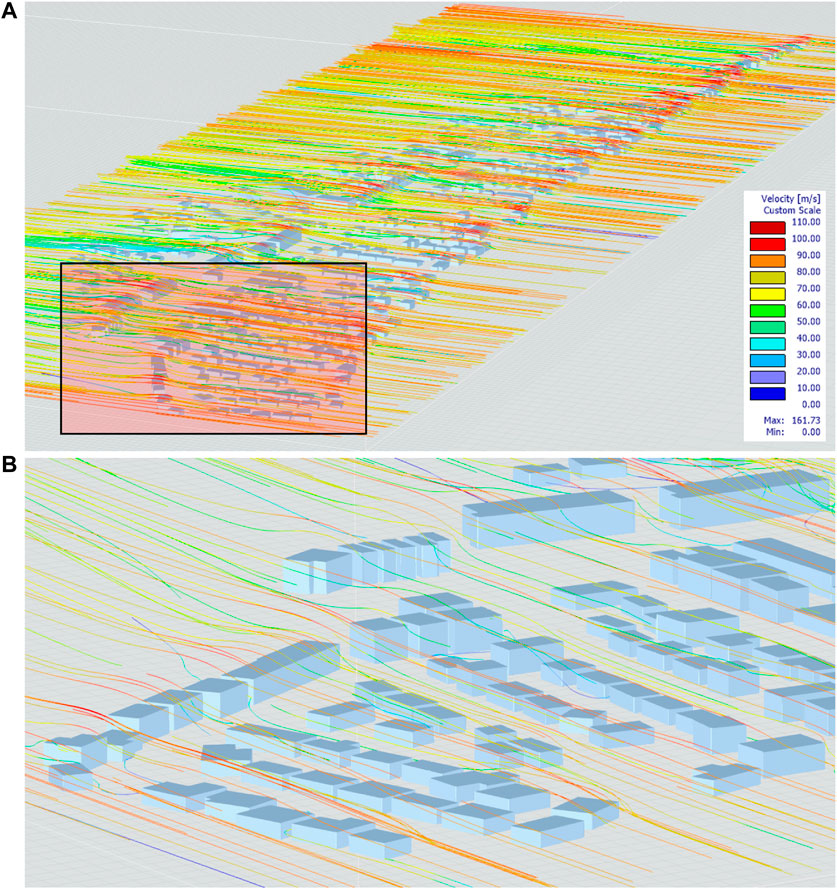
Wind Flow Analysis Results: (A) Wind Flow Lines Across Community Color-Coded Based on Variation of Their Wind Speed; (B) Close-up View on Variation in Wind Flow and Wind Speed
Wind Flow
Wind Speed
Used in
BIM-GIS Integration Approach for High-Fidelity Wind Hazard Modeling at the Community-Level
Share
Copy