
2025-01-15
054971
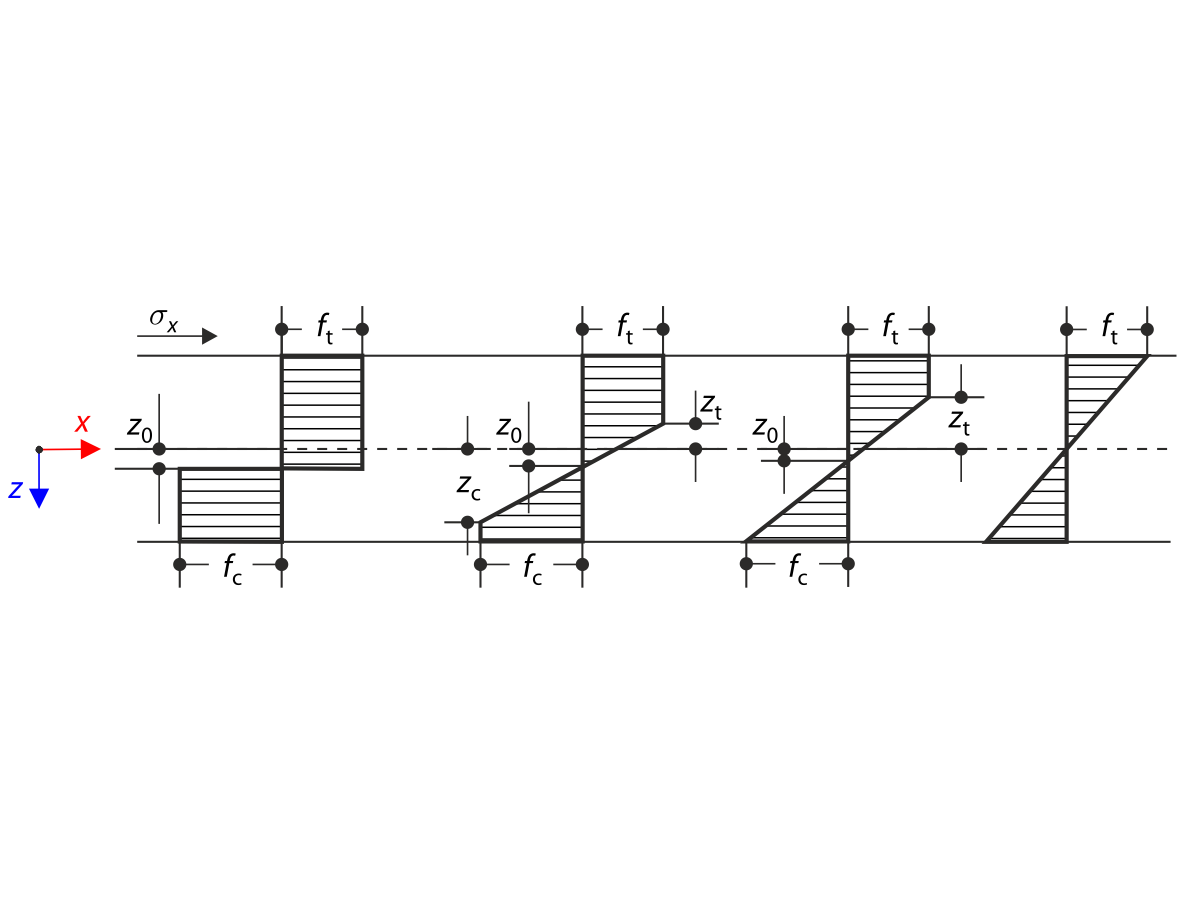
Bending Stress Distribution
Visualization of bending stress distribution with gradient colors on a structural element
The image depicts a gradient color mapping on a beam-like structural element illustrating the bending stress distribution. Warmer hues indicate areas of higher stress, while cooler tones represent lower stress regions. The visualization likely derives from a finite element analysis designed to assess load-induced bending effects.