
2025-02-14
055422
Terrain Flow Analysis – Wind Tunnel Comparison
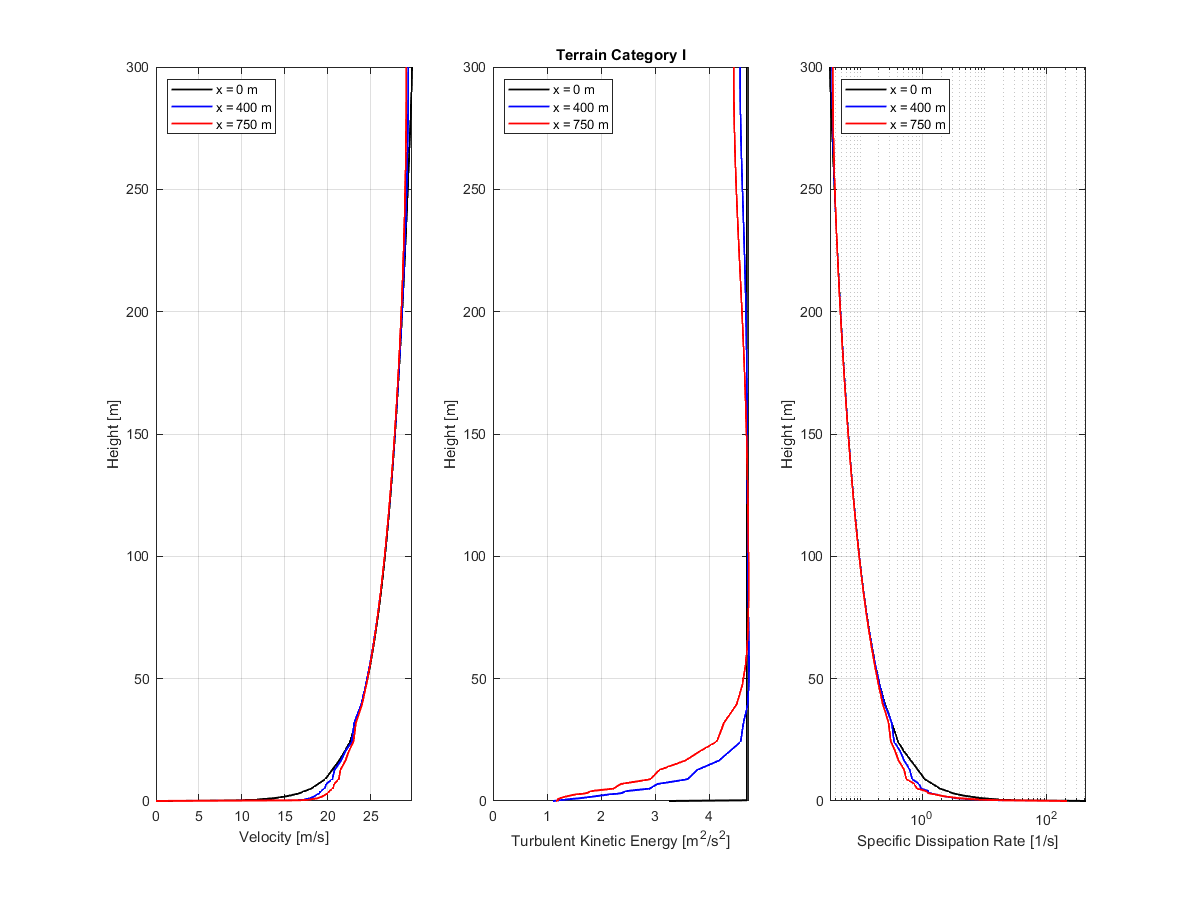
Terrain category I | Diagram comparing velocity, turbulent kinetic energy and dissipation rate across wind tunnel sections.
The diagram displays contour plots from a wind tunnel mid-plane at x=0 m, x=400 m, and x=750 m. It compares distributions of velocity, turbulent kinetic energy and turbulent dissipation rate. Color gradients indicate variations in the flow field, while labeled axes provide spatial coordinates and measurement units. The visual data exemplifies a terrain category I simulation scenario.