
2025-02-14
055423
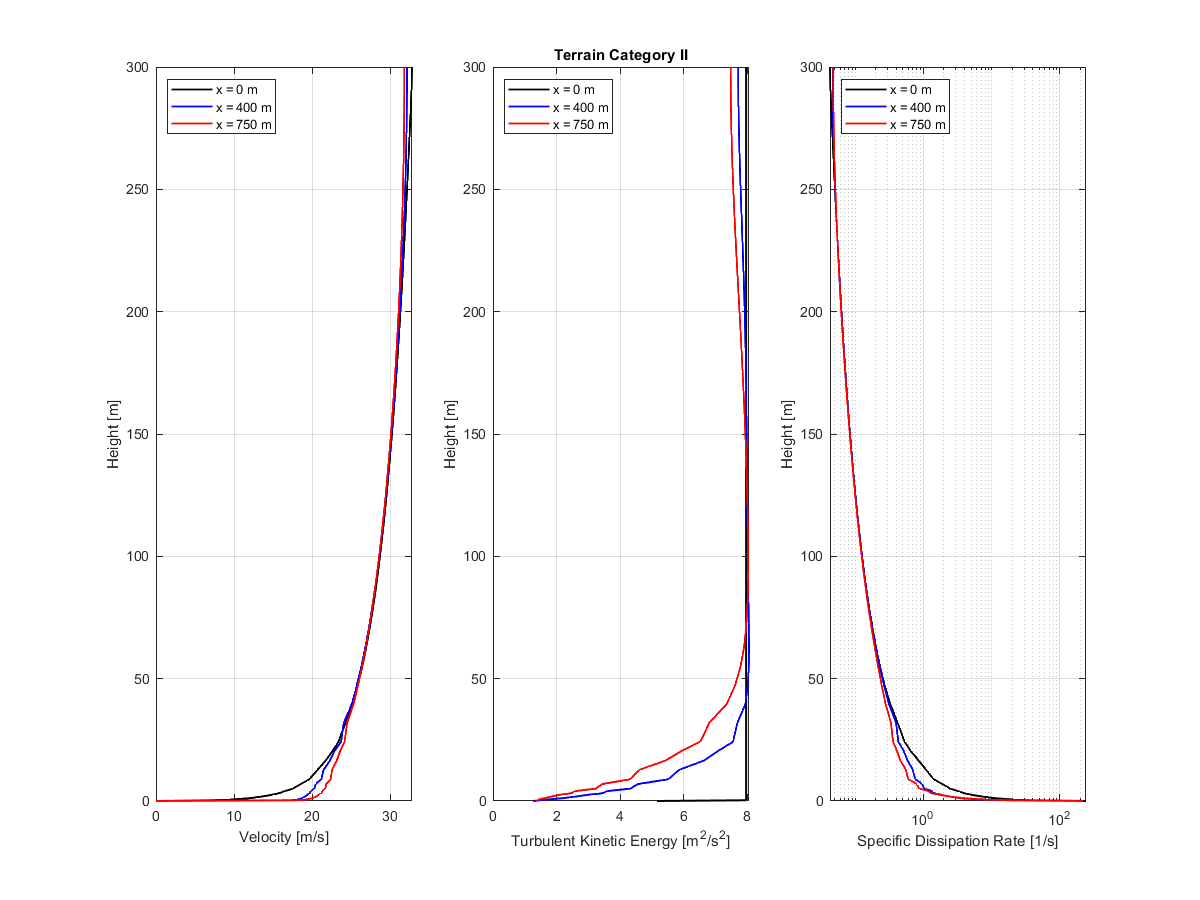
Wind Tunnel Flow Parameter Comparison
Terrain category II | Diagram comparing velocity, turbulent kinetic energy, and dissipation rate in a wind tunnel at three x positions.
This diagram presents a comparative analysis of flow parameters in a wind tunnel middle plane. It illustrates velocity, turbulent kinetic energy, and turbulent dissipation rate at x=0 m, x=400 m, and x=750 m. Distinct graphical elements differentiate each parameter across the sections. The layout emphasizes the spatial variation of aerodynamic properties under Terrain category II conditions.