
2025-02-14
055424
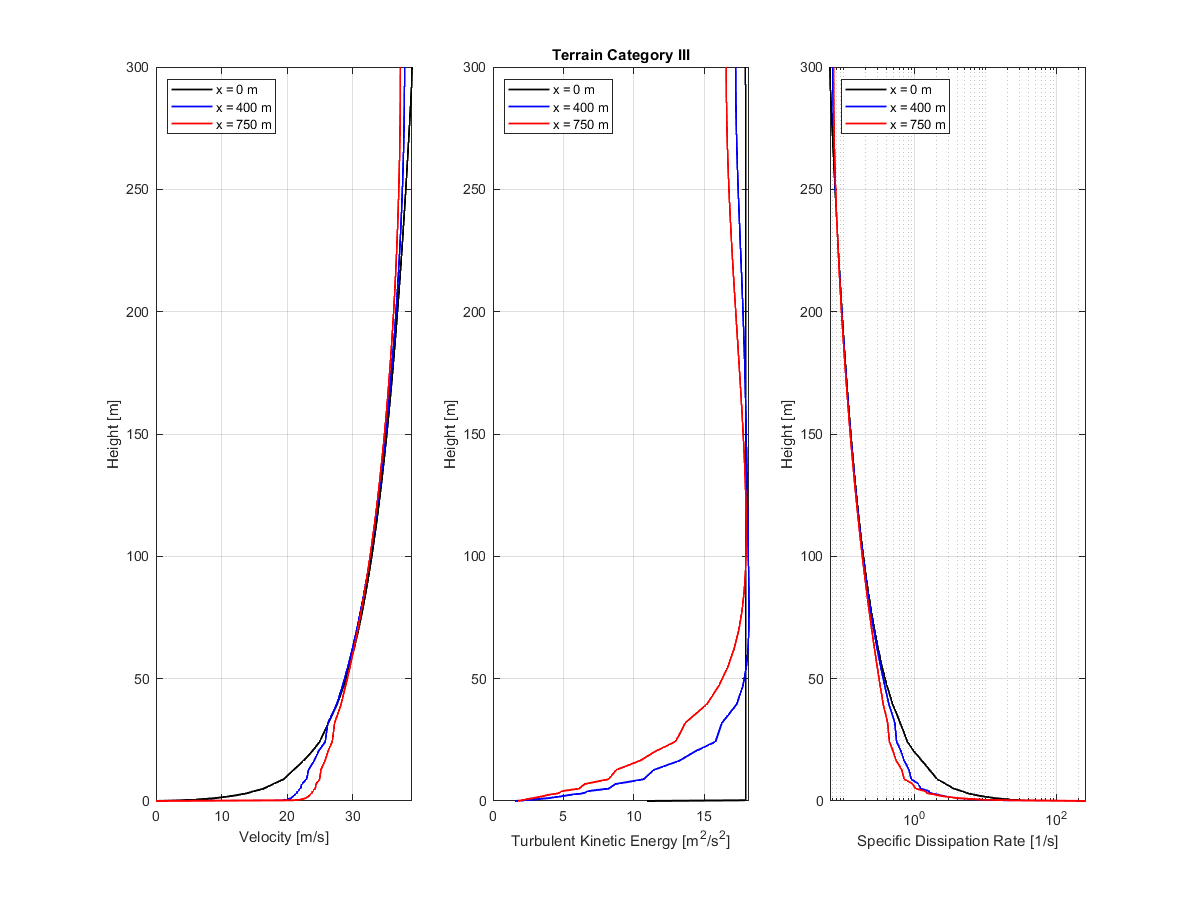
Wind Tunnel Flow Comparison Diagram
Terrain category III | Comparison of velocity, turbulent kinetic energy and dissipation rate across three wind tunnel sections.
The diagram displays three cross-sectional charts of airflow data measured in a wind tunnel for x=0 m, x=400 m, and x=750 m along the middle plane. It compares velocity, turbulent kinetic energy, and turbulent dissipation rate under terrain category III conditions. Each graph features clear line plots that delineate the variations in aerodynamic parameters. The representation facilitates detailed assessment of airflow dynamics across the different sections.