
2025-02-14
055425
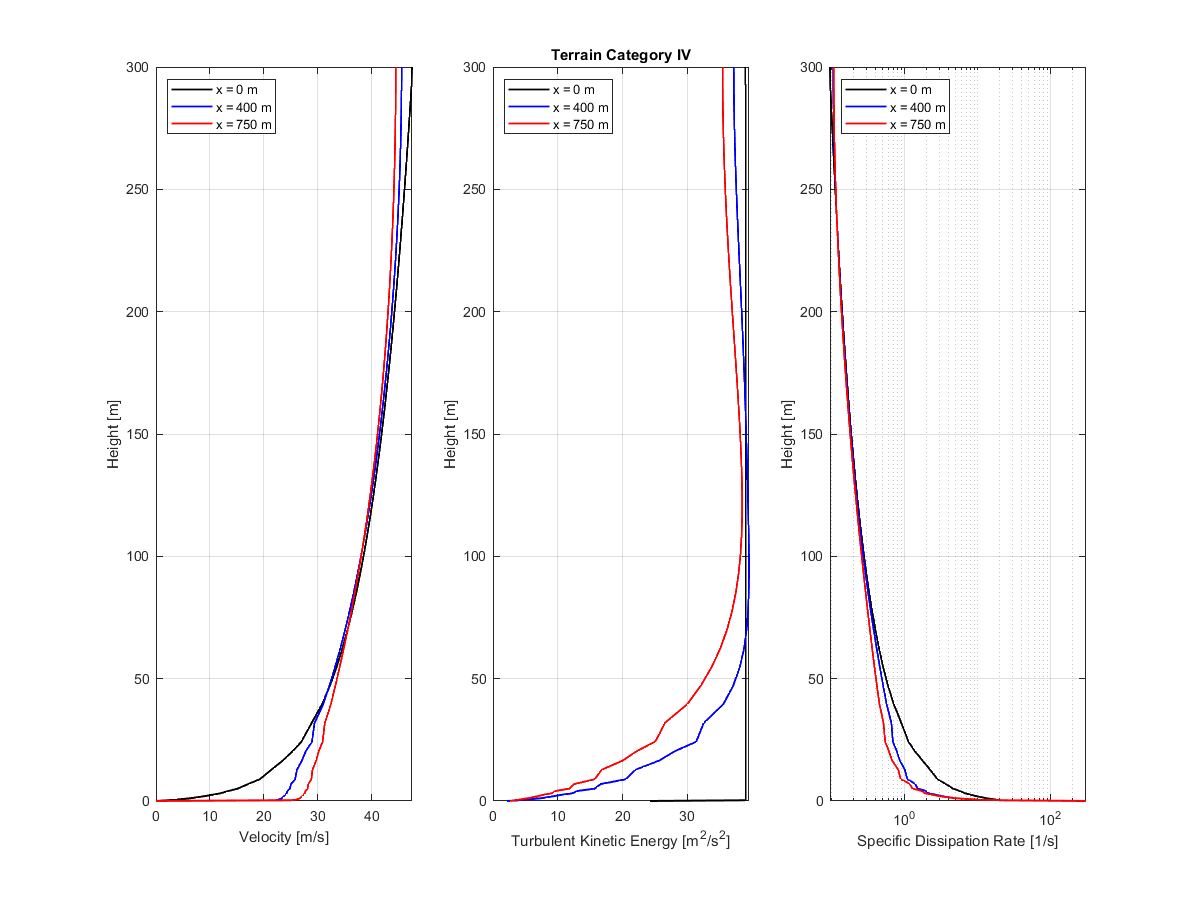
Wind Tunnel Flow Analysis
Terrain category IV | Diagram showing velocity, turbulent kinetic energy, and dissipation at x=0, 400, and 750 m
The diagram compares flow velocity, turbulent kinetic energy, and turbulent dissipation rate in the midplane of a wind tunnel at x=0 m, 400 m, and 750 m. It features distinct curves for each parameter, highlighting spatial differences across the testing section. Labeled axes provide precise measurement scales and units for clear differentiation of the plotted values. The layout effectively illustrates the variations in dynamic behavior under Terrain category IV conditions.