Graph depicting a design response spectrum with plotted curves and thresholds.
2025-02-19
055460
  • RFEM 6
  • Dynamic and Seismic Analysis

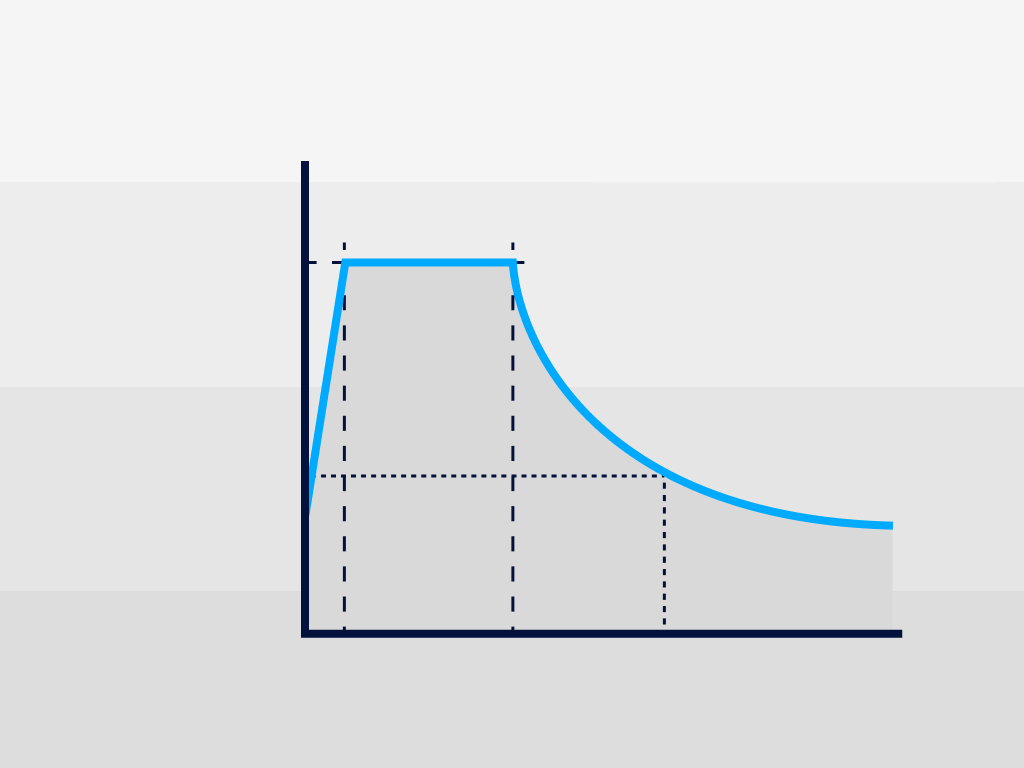
Design Response Spectrum Illustration

Graph depicting a design response spectrum with plotted curves and thresholds.

The image displays a design response spectrum chart with plotted curves that represent structural response over a range of frequencies. Axes are marked to indicate response levels and dynamic behavior, supporting the analysis of frequency-dependent effects.
  • Design response spectrum
  • Graphical representation
  • Engineering analysis
  • Structural dynamics
  • Vibration analysis
Used in
  • Design Response Spectra: Fundamental Basis of Earthquake Engineering
Share