

2025-03-05
055677
Eigenvalue Analysis Grouping | Nodes, Surfaces, Member, Lines
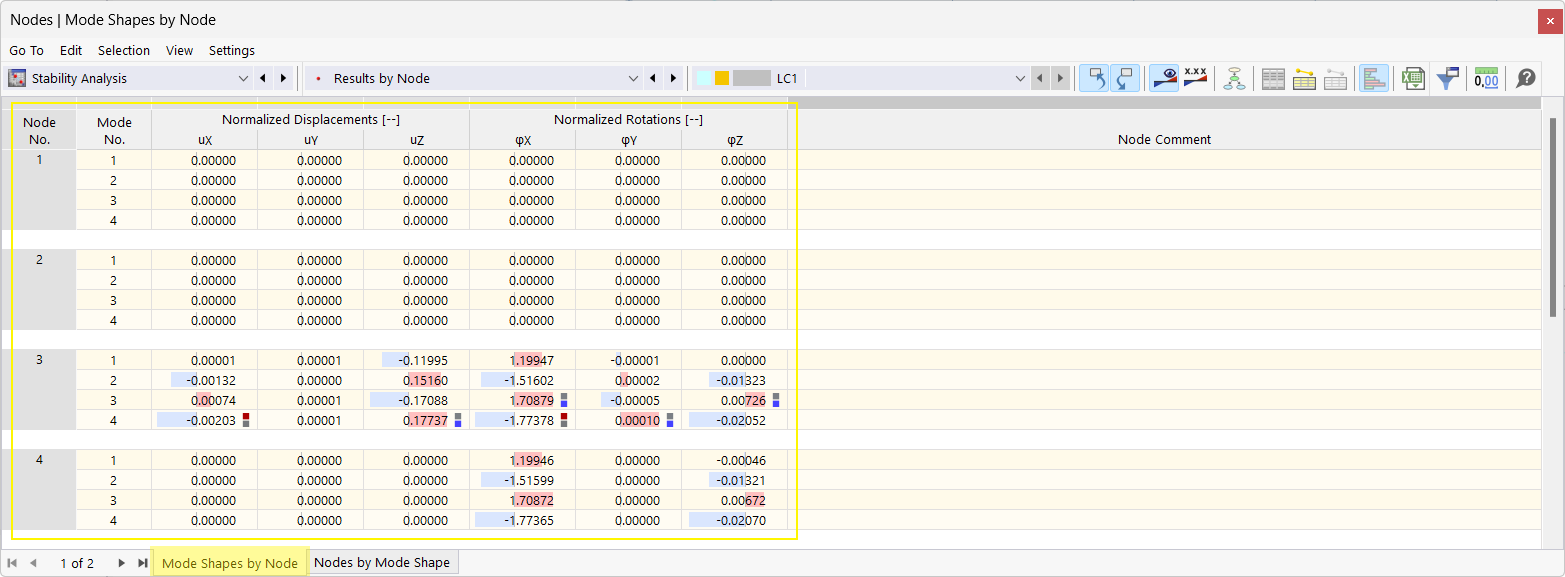
The figure shows how results from eigenvalue analyses are grouped by node, surface, member, and line number.
The display groups the results of eigenvalue analyses by specific element numbers. The results are categorized by node, surface, member and line numbers. Precise assignments of the vibration values to the individual structural elements are shown.
2025-03-05
055678
Results by Mode Shape
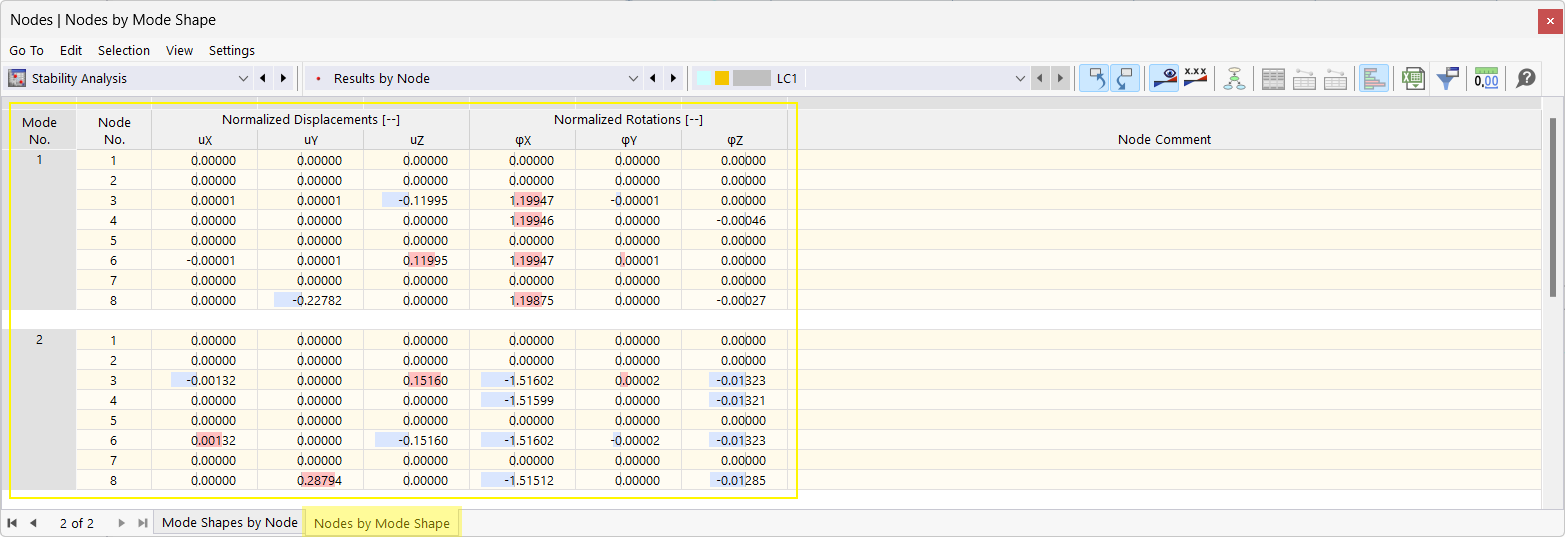
The diagram categorizes the results of eigenvalue analyses according to mode shape.
The image shows the systematic grouping of the results of eigenvalue analyses according to individual mode shapes. Different mode shapes are displayed as independent categories. The display uses precise technical elements to clearly assign the analysis results. The results are clearly divided into groups.