
2025-03-14
055820
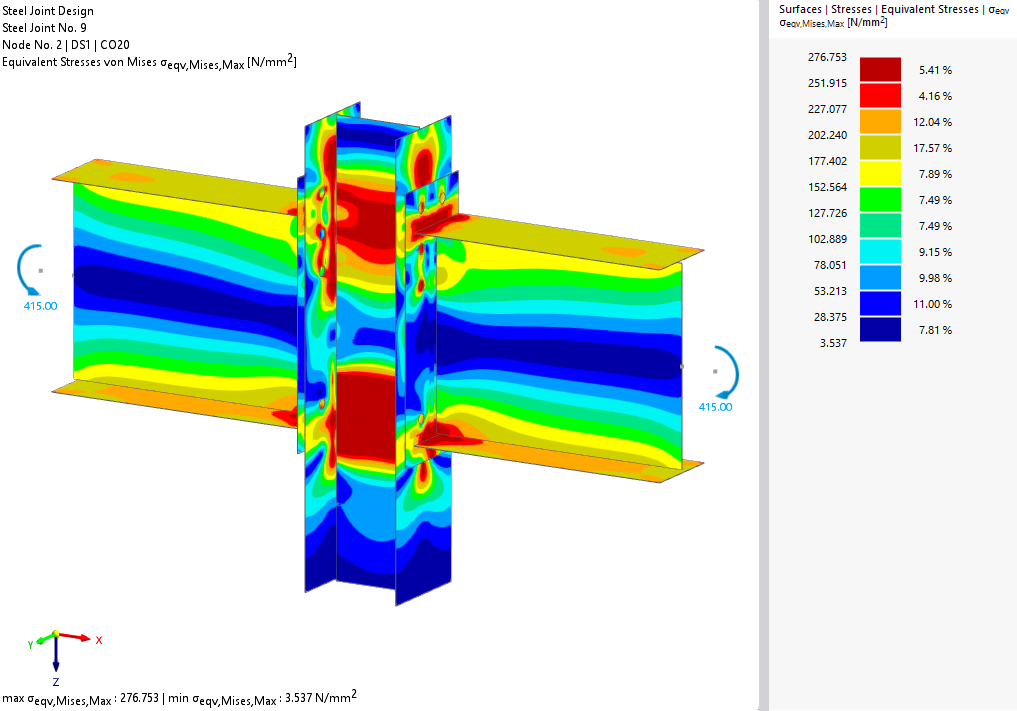
Equivalent Stresses Shown on the Joint Geometry
Visual representation of equivalent stresses on a joint, illustrating stress distribution and potential stress concentration areas.
The image shows the equivalent stresses depicted on a joint structure, highlighting areas of stress concentration. The graphical representation utilizes a color gradient to indicate varying levels of stress intensity on the joint's surface. The stress analysis provides insights into potential weak points, which are critical for structural assessments.