
2025-03-17
055846
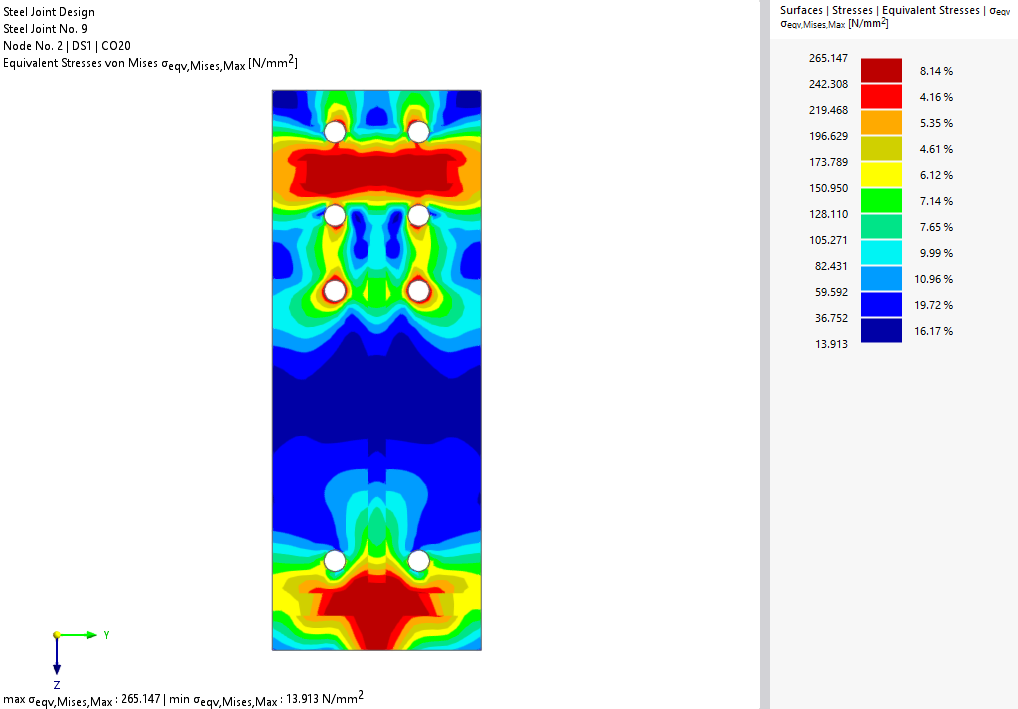
Equivalent Stresses Shown on the End Plate
Visual representation of equivalent stress distribution on an end plate, showing color-coded stress variations.
The image displays the equivalent stress distribution on an end plate, with variations indicated through color graduations. This visualization highlights areas of different stress intensities, allowing for a detailed analysis of structural behavior under loads. The stress values are represented in a gradient, typically ranging from blue for low stress levels to red for high stress concentrations.