
2025-07-13
057765
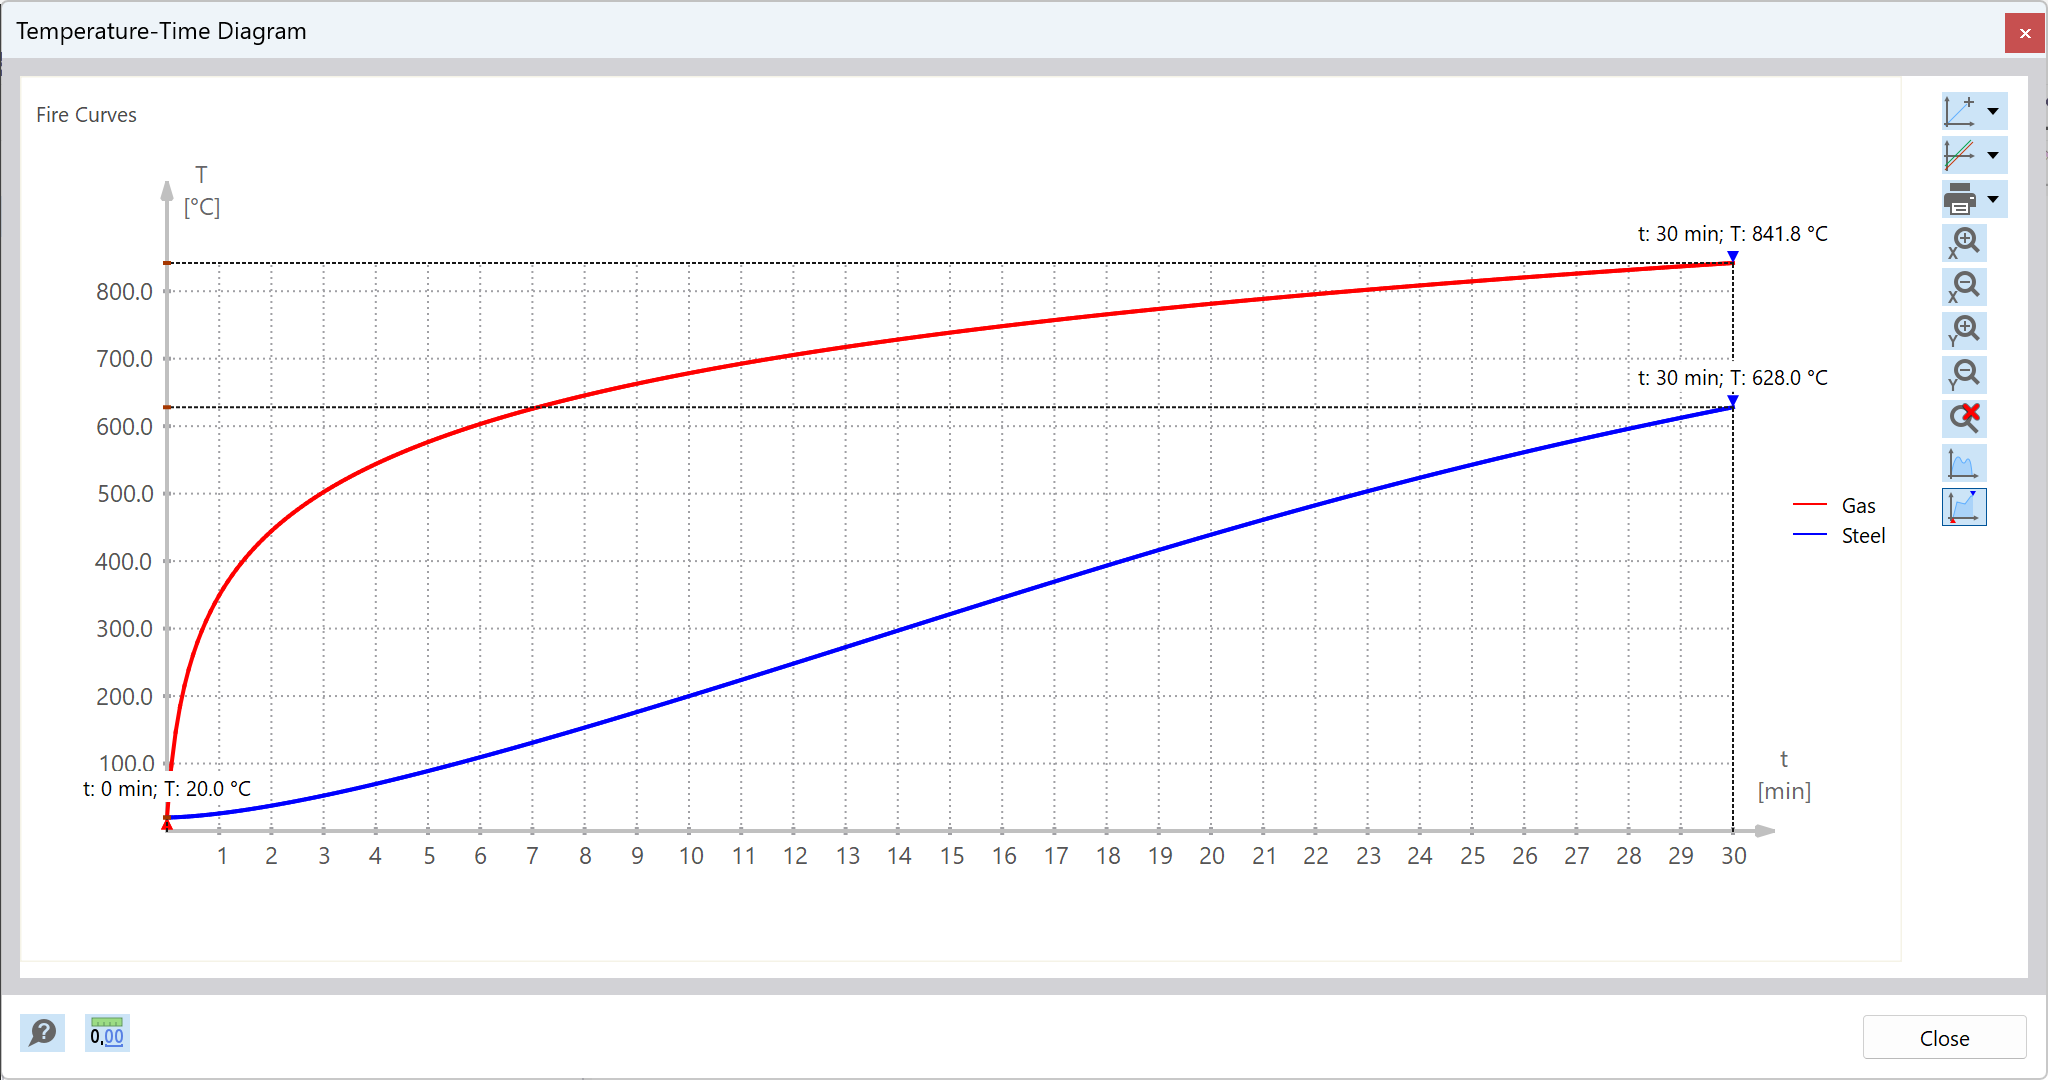
Temperature-Time Diagram for Steel Structure Fire Design
The diagram illustrates the temperature evolution of a component in fire resistance for evaluating steel structure safety.
The diagram displays a temperature-time curve relevant for assessing the fire resistance of structural components over time. This curve represents how the temperature varies throughout a given duration, critical for steel structure design. It provides the data necessary for tracking and analyzing thermal behaviors during a fire event.