
Temperature-Time Diagram for Fire Resistance Design
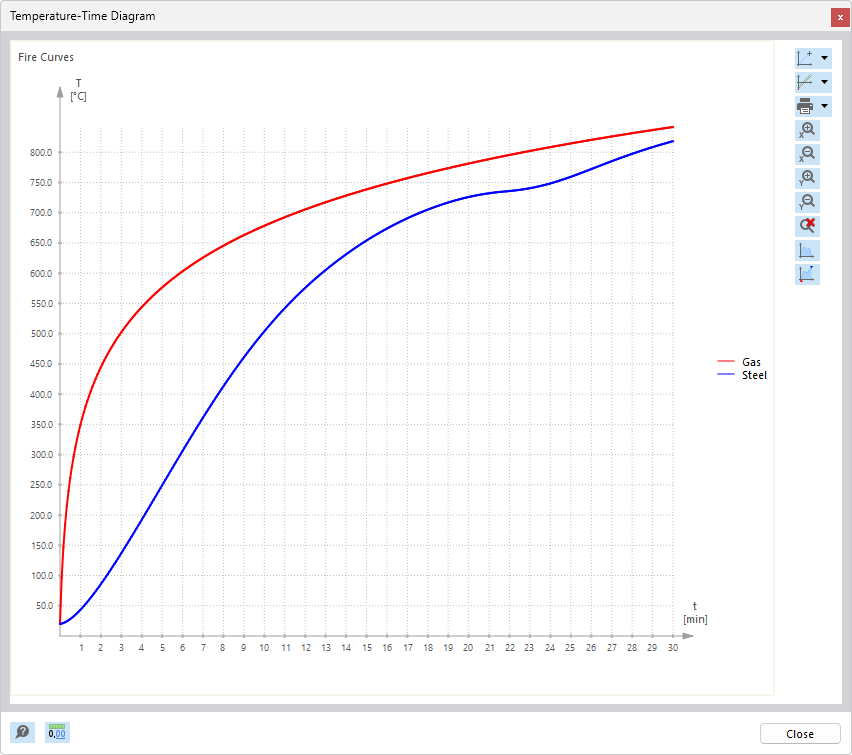
The diagram shows the temperature distribution of a structural component in fire resistance over a specific period of time.
The diagram shows the component temperature distribution over time in a fire resistance context. It is used for detailed evaluation of the temperature distribution, which is crucial for structural steel design. This diagram provides engineers with the ability to track the temperature development with regard to fire resistance design. Detailed temperature properties are also included to enable informed decisions.