
2026-03-24
061965
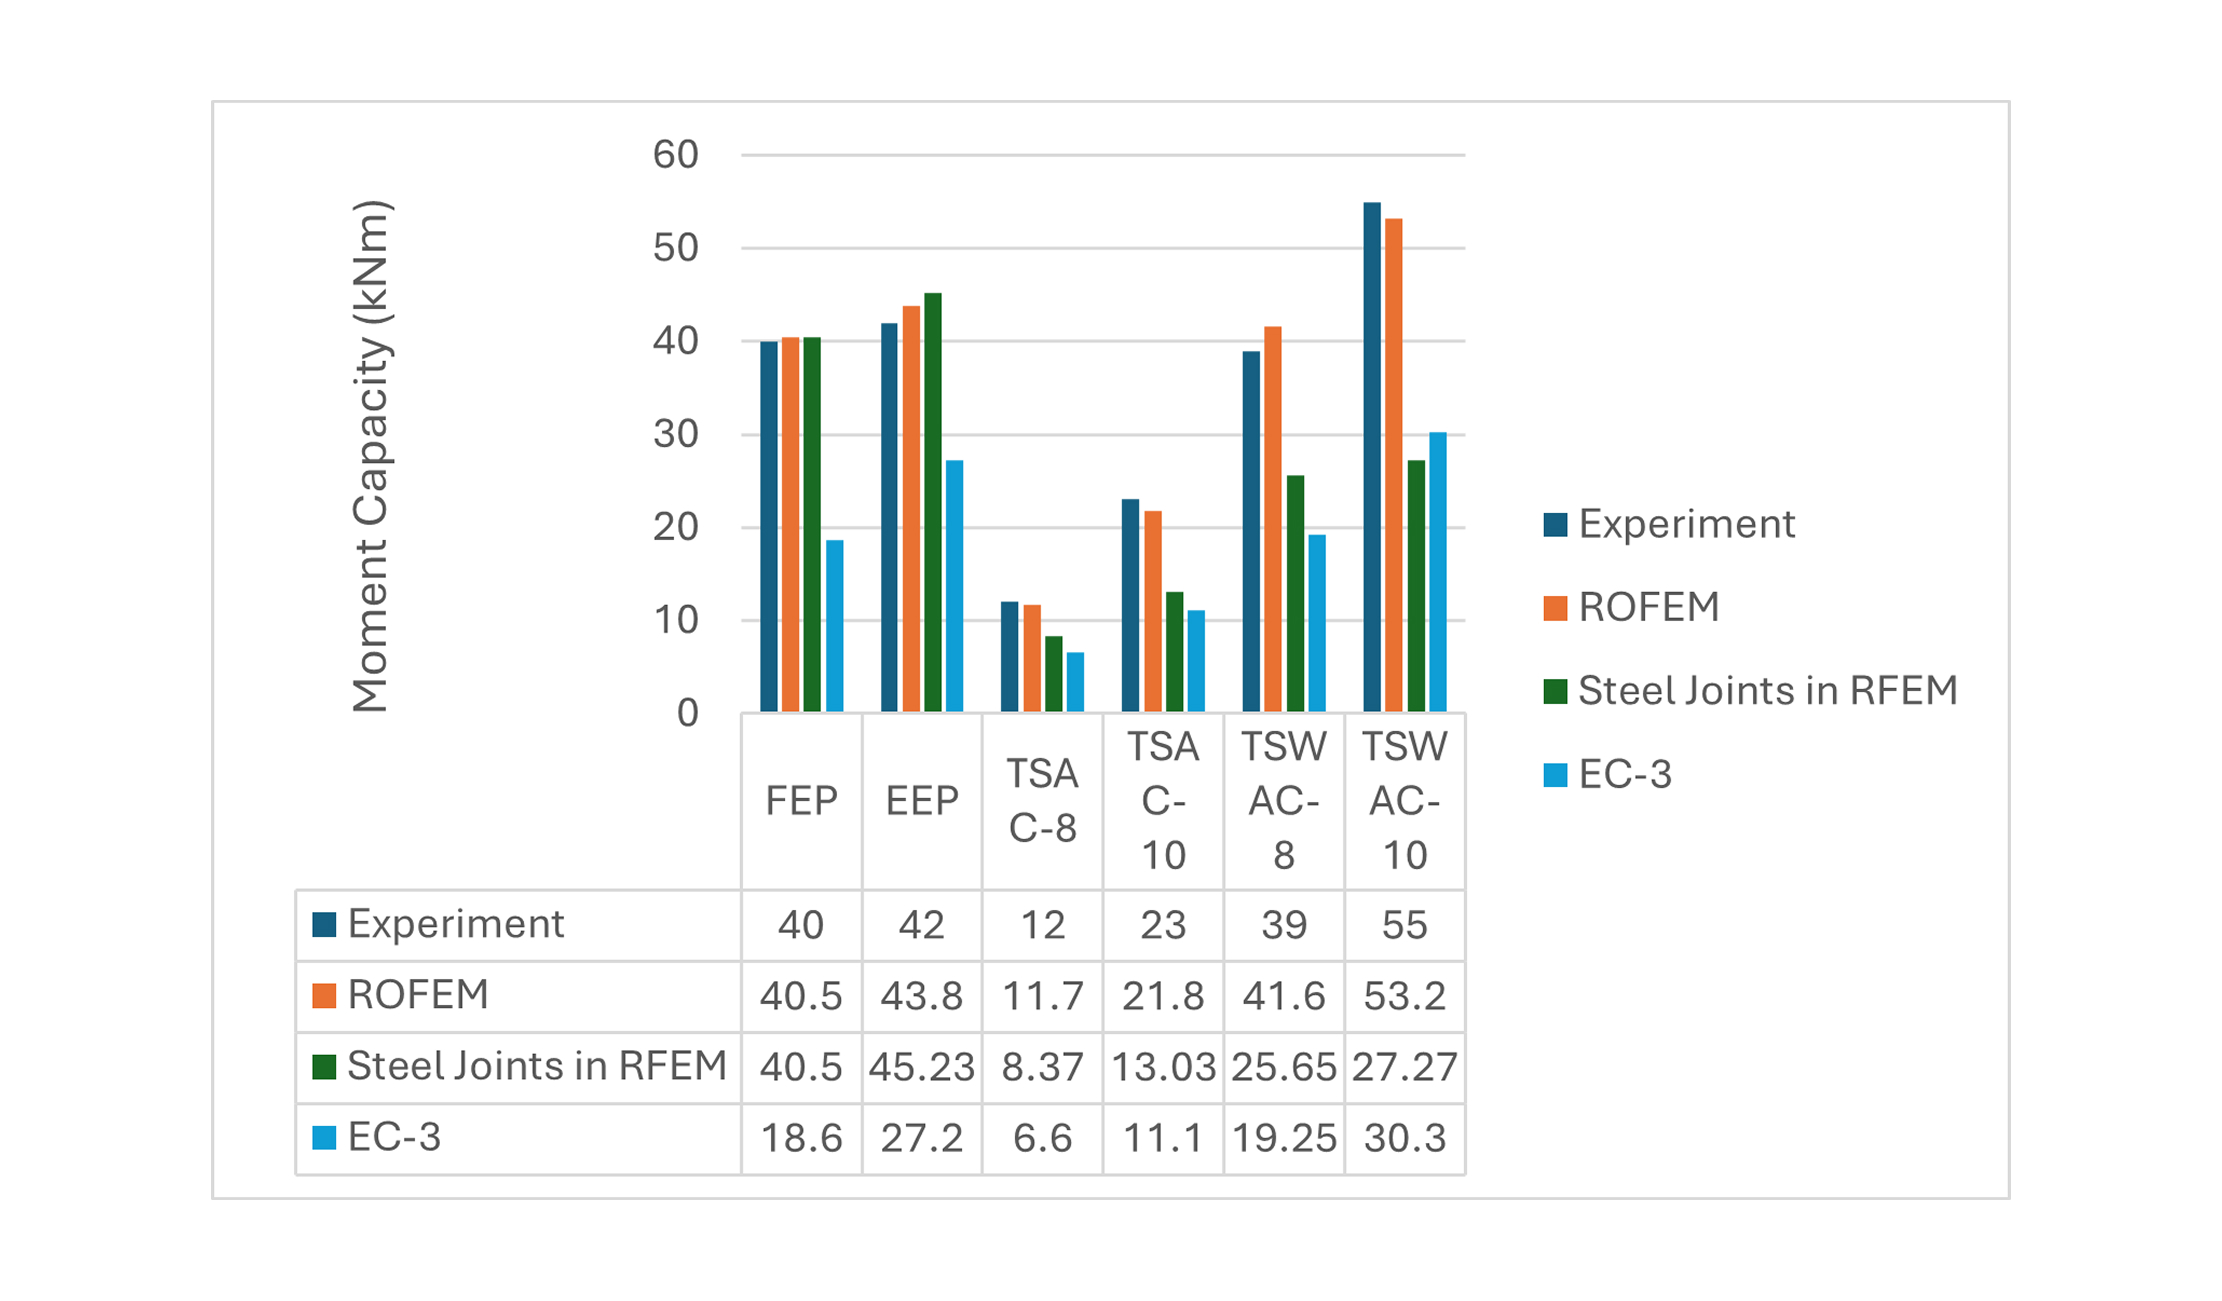
Comparison of Moment Resistance – Experimental, ROFEM, Steel Joints in RFEM, and EC 3
Graph showing comparison of moment resistance from experimental data, ROFEM software, steel joints in RFEM, and EC 3 standards.
The image illustrates a graph comparing the moment resistance across different methodologies: Experimental results, ROFEM software calculations, steel joint analyses in RFEM, and European standards EC 3. The graph provides a visual representation of how these methods align or differ in their calculations of structural resistance.