
2026-03-24
061966
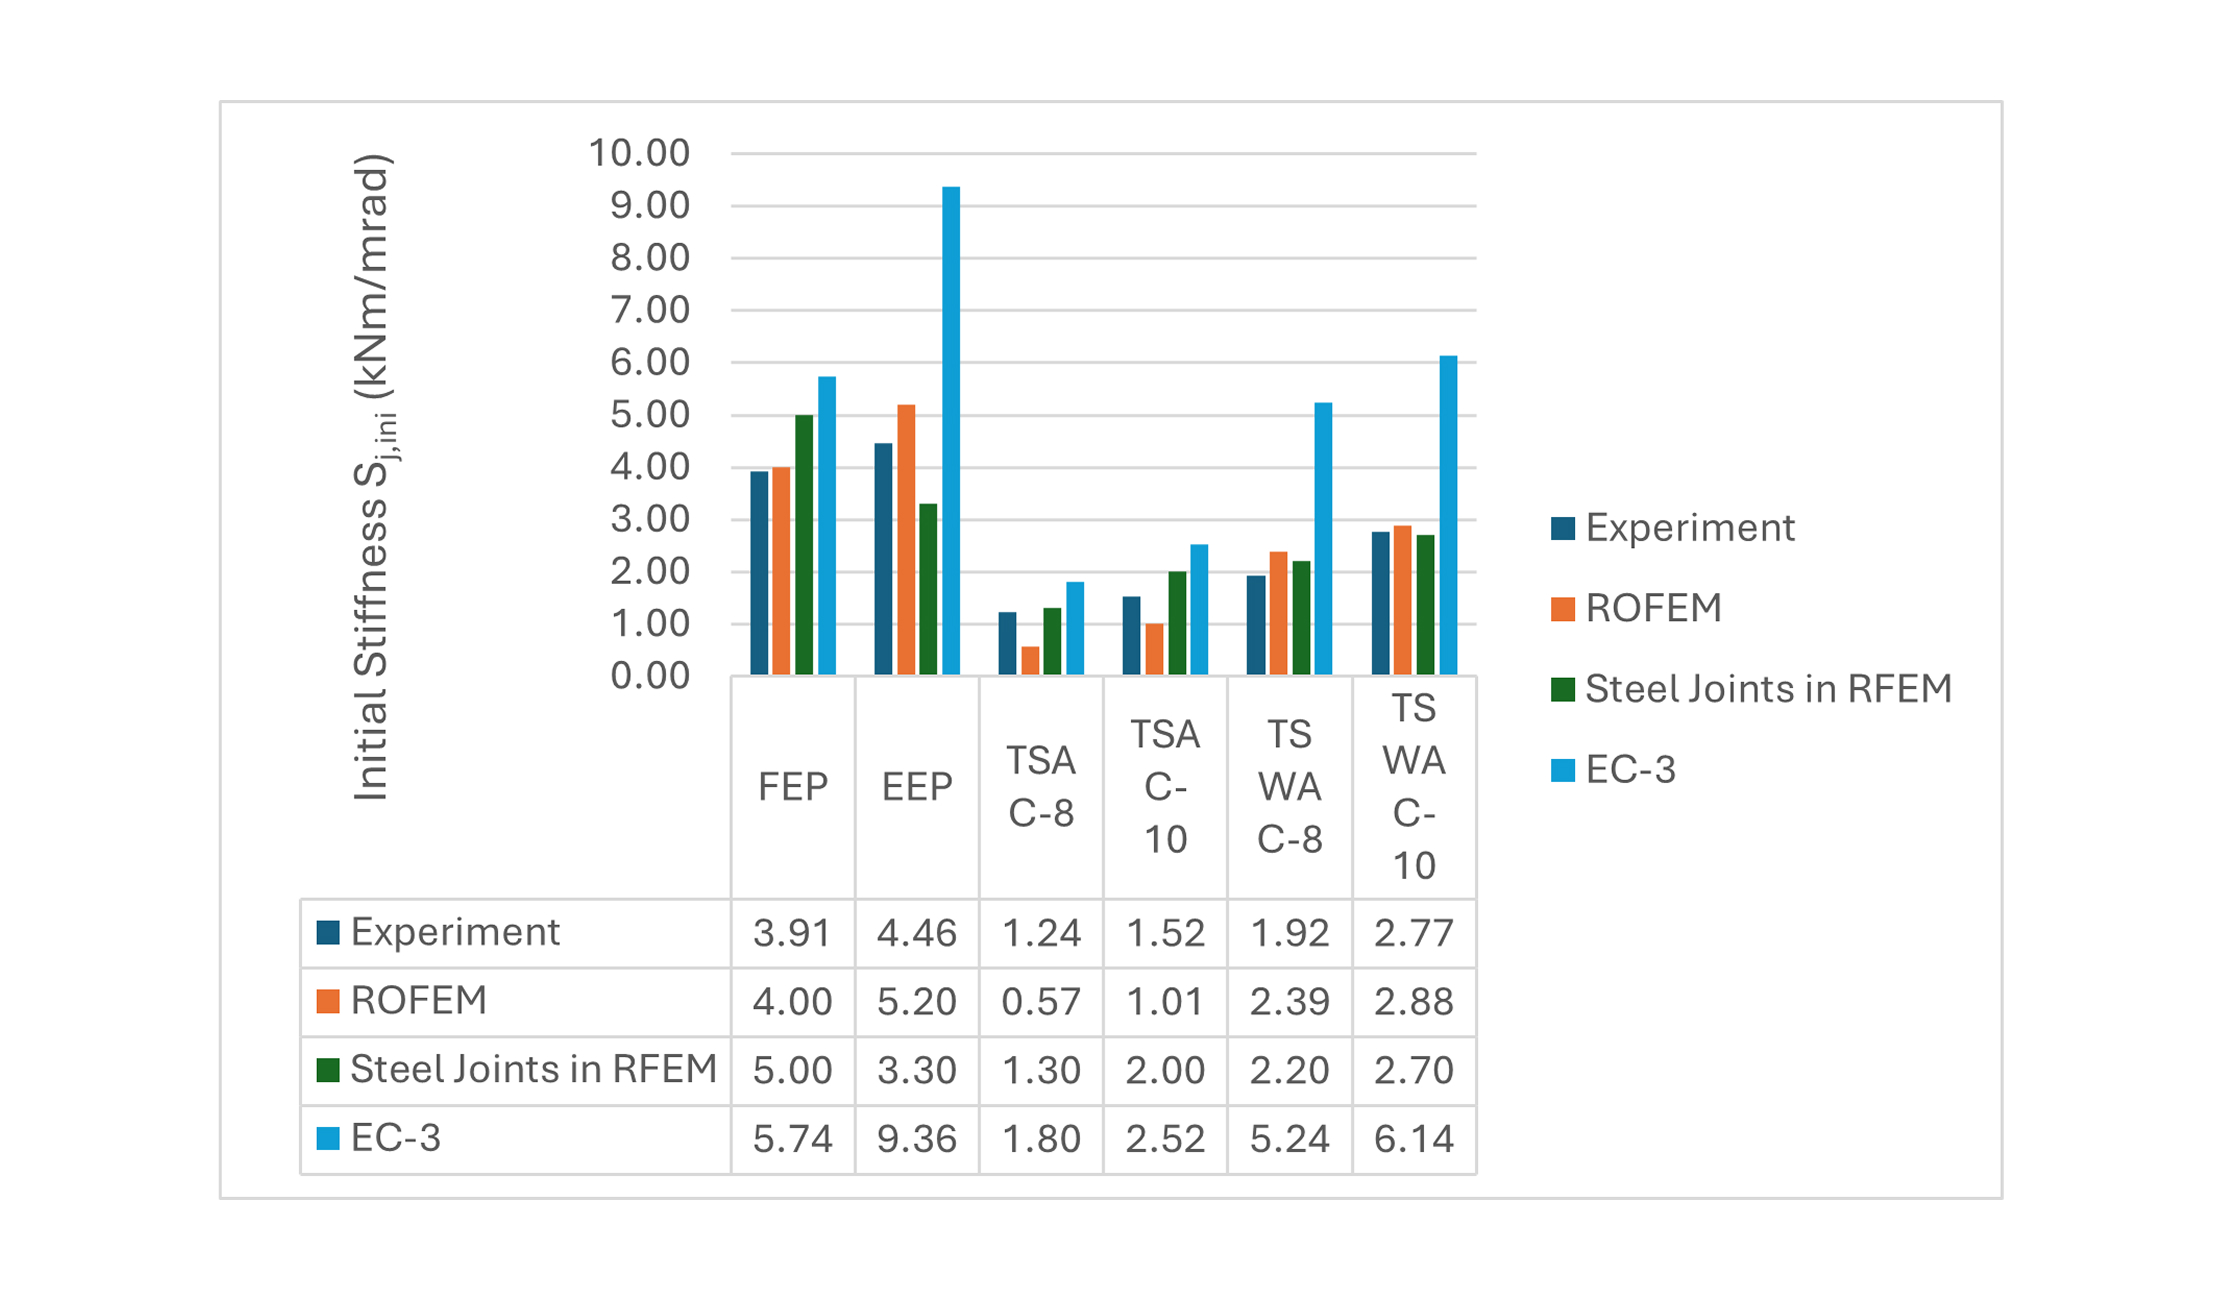
Comparison of Stiffness – Experimental, ROFEM, Steel Joints in RFEM, and EC-3
Graph showcasing stiffness comparison between experimental analysis, ROFEM method, and RFEM-based steel joints using EC-3 criteria.
The image depicts a comparative analysis of joint stiffness using various methods. It includes experimental data, the ROFEM method, and results from RFEM software for steel joints in adherence to EC-3 guidelines. The graph highlights the differences in stiffness outcomes between these methods.