
2026-03-27
062047
Emissions by Cross-Section in Table
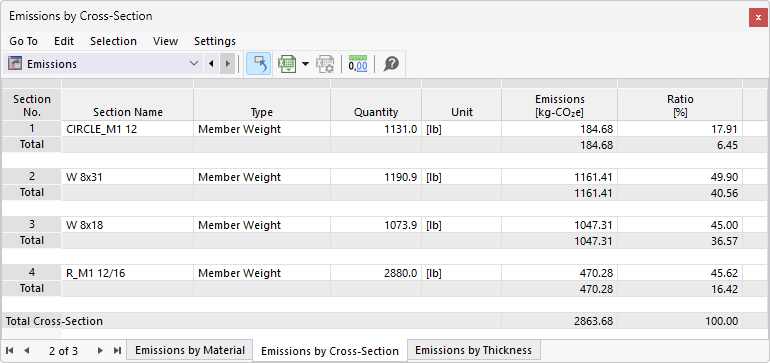
Emissions by cross-section in the table
The image shows a display of emission values sorted by different cross-sections. This visualization allows for the comparison of emission data across different categories based on structural parameters. Such a table serves as a tool for engineers and analysts to evaluate and optimize the impact of structures on environmental factors.