2026-09-03
064656
Global Deformations of Molino Bridge in RFEM
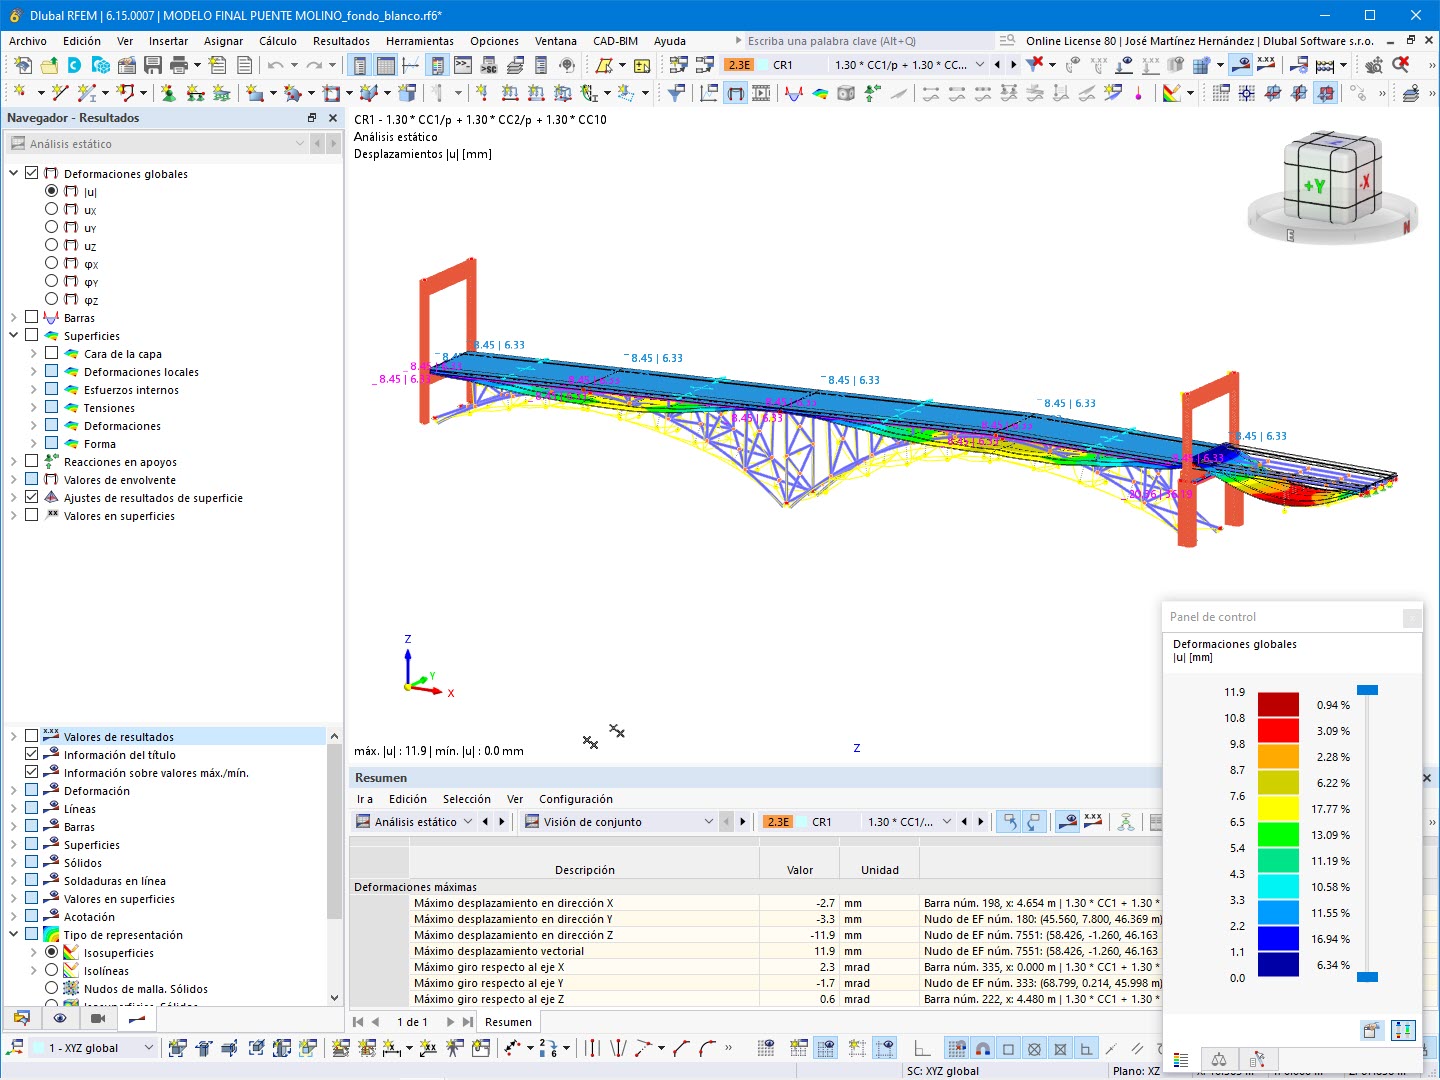
Visualization of global deformations in mm for the Molino Bridge calculated using RFEM, showing maximum displacements in the result combination
The RFEM model of the Molino Bridge shows the global deformations for result combination CR1, defined as 1.30 * CC1/p + 1.30 * CC2/p + 1.30 * CC10. The isoline plot on surfaces indicates a maximum displacement of 11.9 mm in the Z direction and a maximum vector displacement of 11.9 mm. The summary table lists the maximum displacements in the X, Y, and Z directions, as well as the maximum rotations about the X, Y, and Z axes, with reference to the corresponding nodes and members. The control panel displays the color scale for global deformations in mm. The results browser shows the active options for global deformations, support reactions, and surface values.