2026-09-24
065120
Determination of Buckling Curve Manually
Defining buckling curve manually
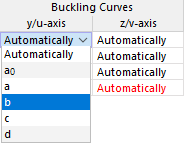
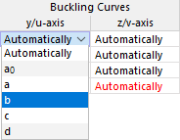
The image shows an input list for defining the buckling curve for the stability analysis. The entries include the options 'Automatic', 'a0', 'a', 'b', 'c', and 'd', where 'b' is selected. In addition, the columns 'y/u-axis' and 'z/v-axis' are shown with the setting 'Automatic'. According to EN 1993, the buckling curves a0, a, b, c, and d correspond to imperfection factors α of 0.13 to 0.76 and describe the reduction factor χ as a function of the relative slenderness λ̄.