
09.02.2025
055339
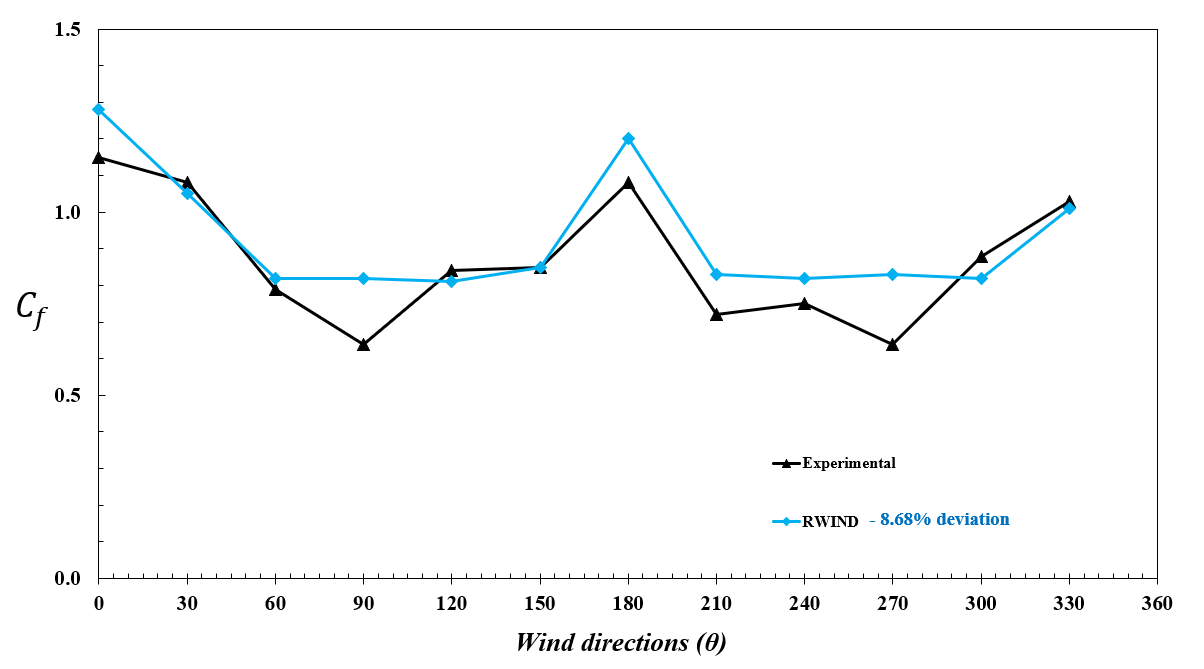
Comparison of Wind Load Coefficients from Experiment and RWIND Simulation
Graph comparing experimental and RWIND simulation wind load coefficients
The diagram illustrates the force coefficient Cf as a function of wind direction θ, ranging from 0° to 360° on the x-axis and approximately 0.0 to 1.5 on the y-axis. It features a black curve representing experimental data and a blue curve labeled "RWIND – 8.68% deviation." Notable deviations occur between 30°–60° and 150°–210°, with the blue curve sometimes above and sometimes below the experimental values, indicating an average deviation of 8.68%.