2023-08-25
042351
RFEM 6
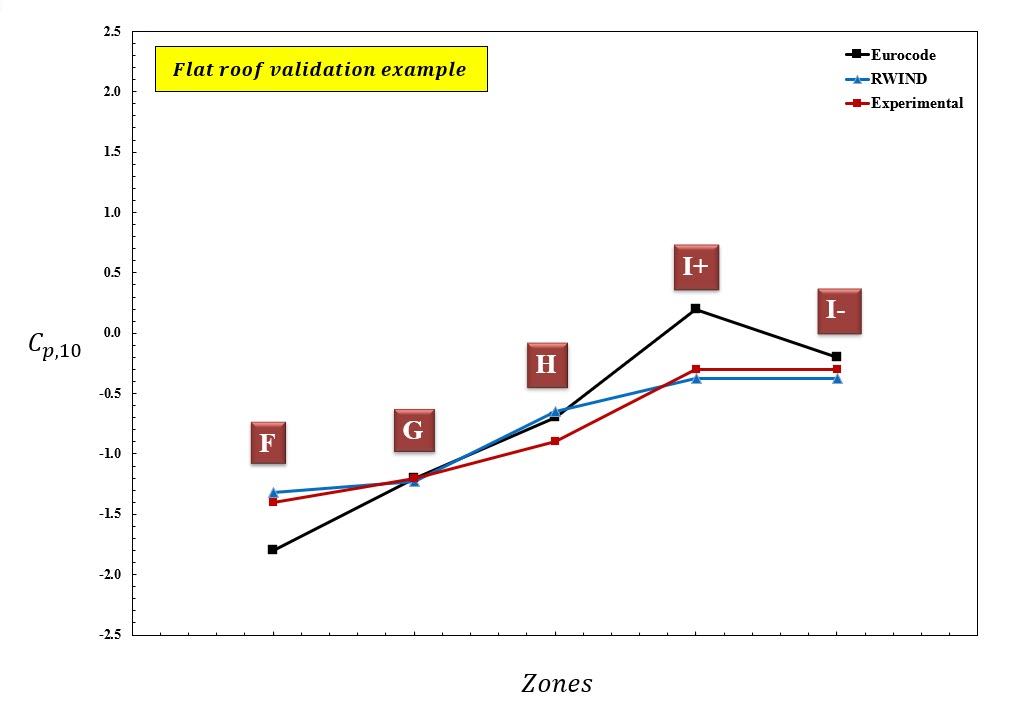
Rysunek 3: Wykres wartości Cp,10 dla różnych stref wiatru i intensywności turbulencji dla terenu 2
Wykorzystano w
Validation Example for C
p,10
and C
p,1
Value of Flat Roof (Sharp Eaves) with Comparison to EN 1991-1-4 and Japanese Wind Tunnel Data Base
Udostępnij
Kopia