Do you have any questions about Dlubal products or need assistance in selecting the right one for your project?
I'm here to help. You can easily reach me through the contact options provided below.
Looking forward to hearing from you!


Result Evaluation and Printout Report
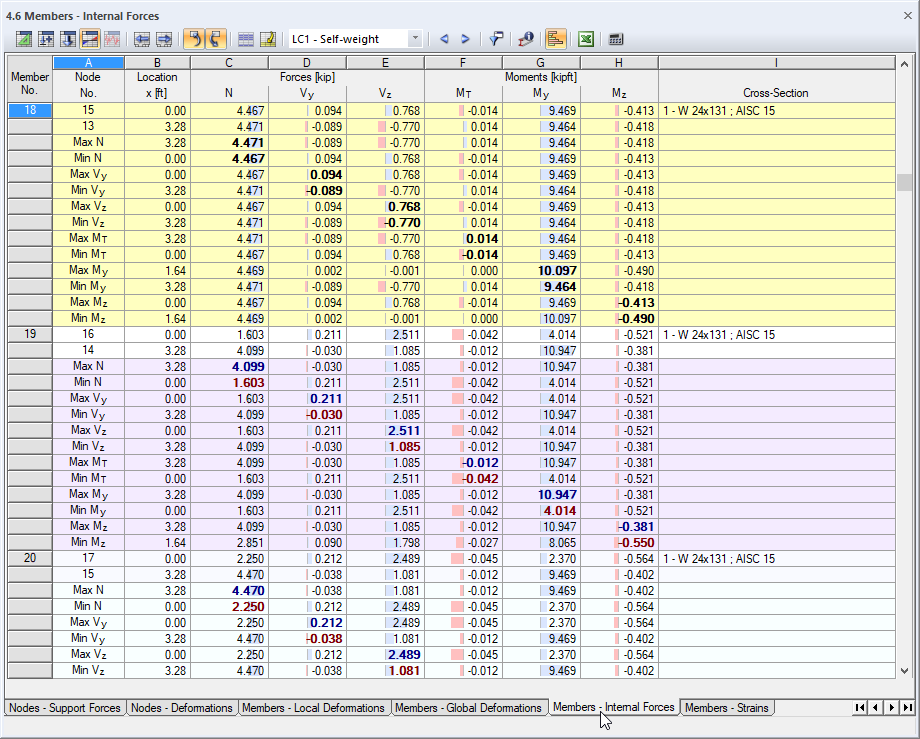
Colored Representation of Internal Forces and Moments
The result tables show in color whether the internal forces are positive or negative, as well as showing the relation to the extreme values. The result tables of the design modules use color scales to represent the respective design ratios. This way, the governing locations are apparent immediately.
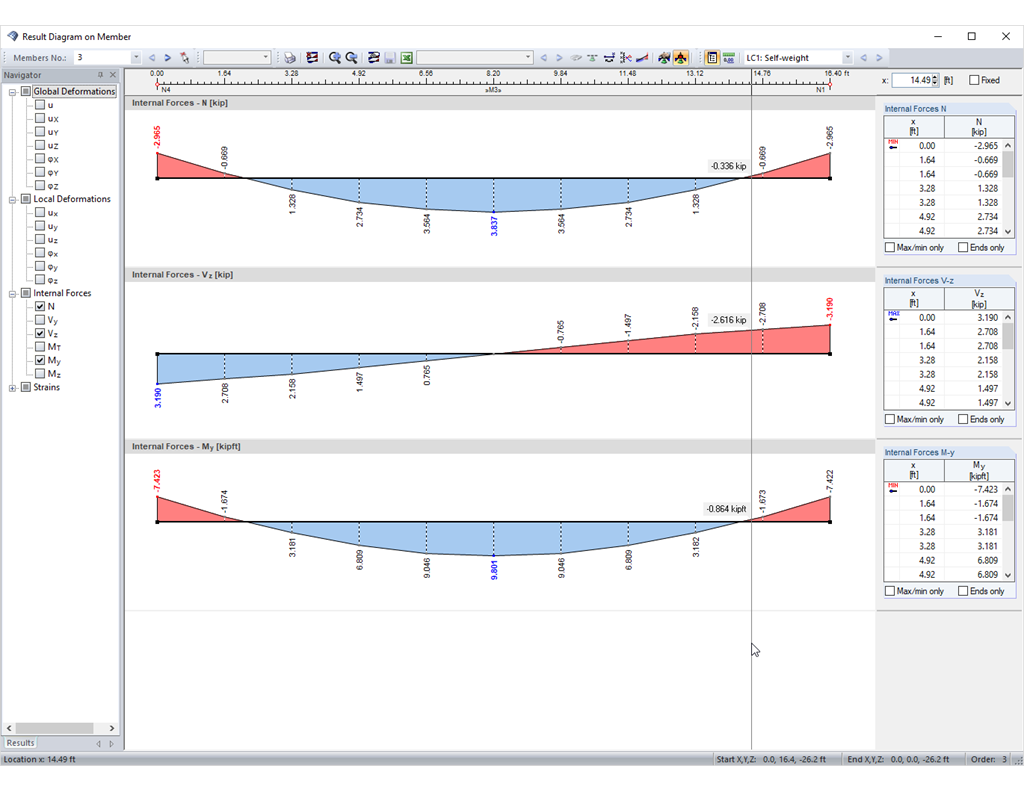
Result Diagrams
The result diagrams of members, surfaces, and supports are freely configurable: You can define smooth ranges with average values or, if necessary, display and hide the result diagrams. This option ensures targeted evaluation of the results. All diagrams can be added in the printout report.
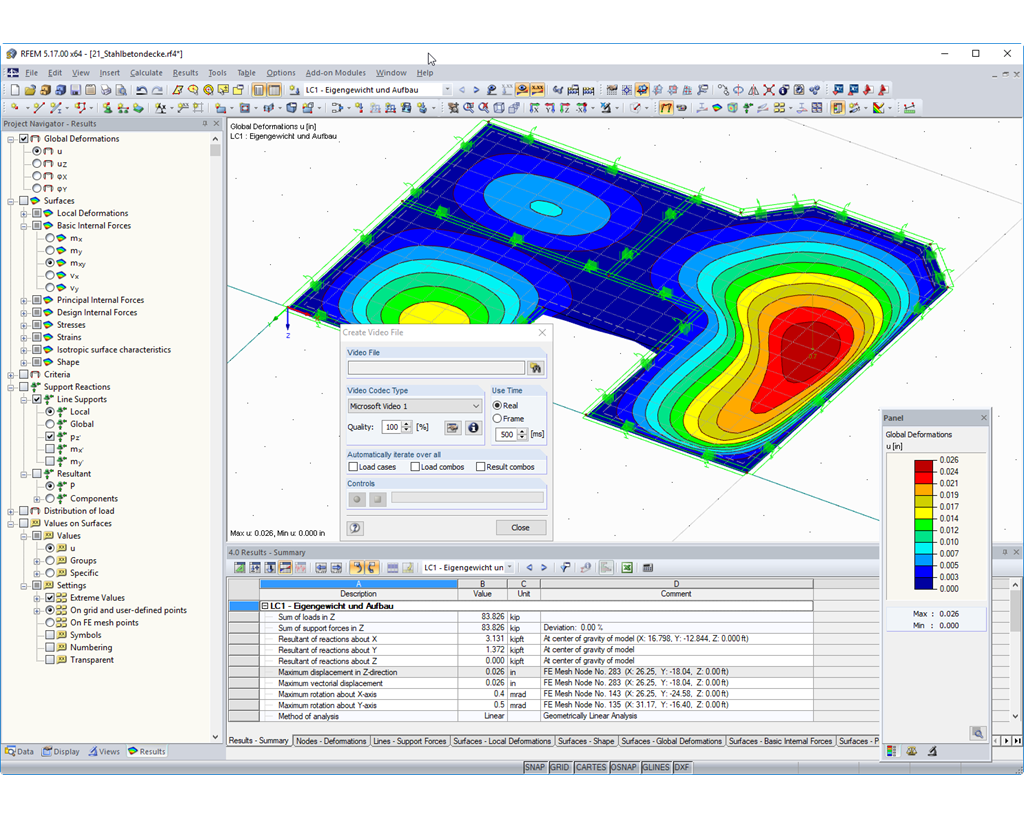
Visualization of Results
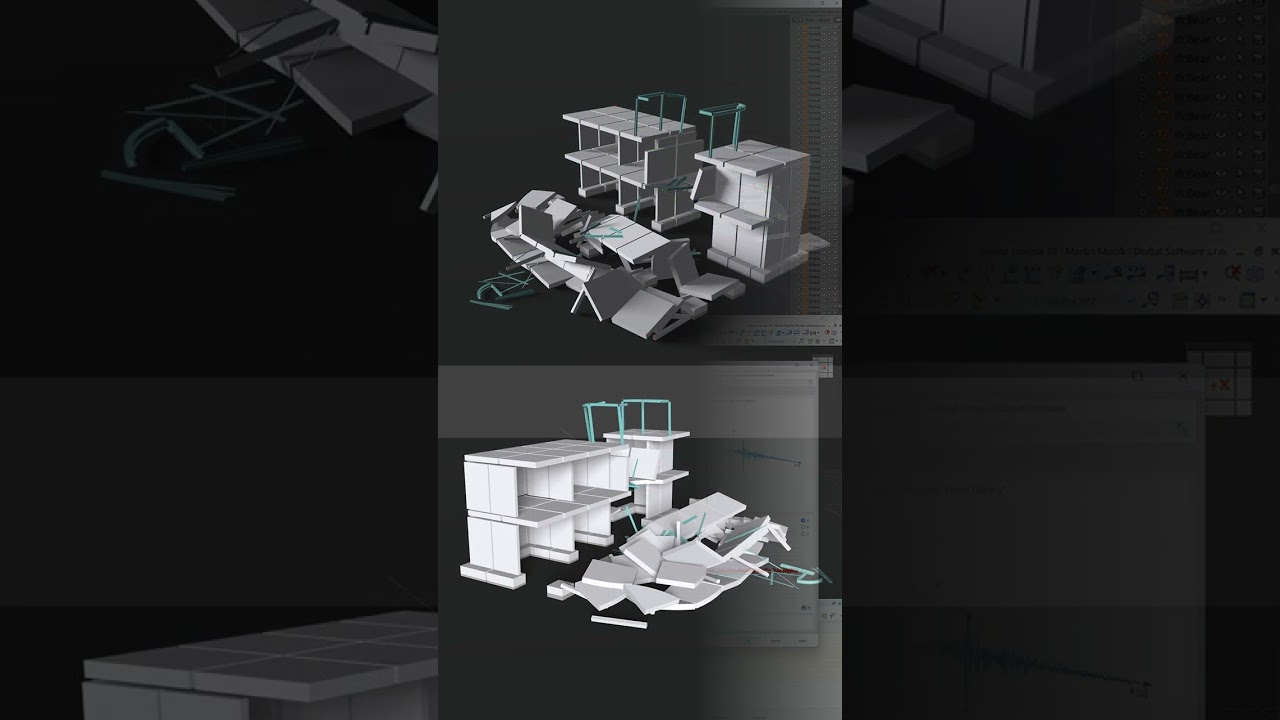
The results on a rendered model are represented by a number of colors in order to easily detect deformations such as member rotation. You can freely define the colors and the range of values in the control panel. Deformations, surface stresses, and internal forces can be animated and saved as a video file.

Detailed Result Tables
The first result table displays a summarized overview providing the equilibrium of forces in the structural system and the maximum deformations. Information about the calculation process is included as well. You can filter the result tables by specific criteria such as extreme values or design locations.

Mass Print of Graphics
There is a mass print function for the model data, loads, and results. It is possible to create graphics from different defined directions. For example, you can print all internal forces as an isometric view with a single mouse click.
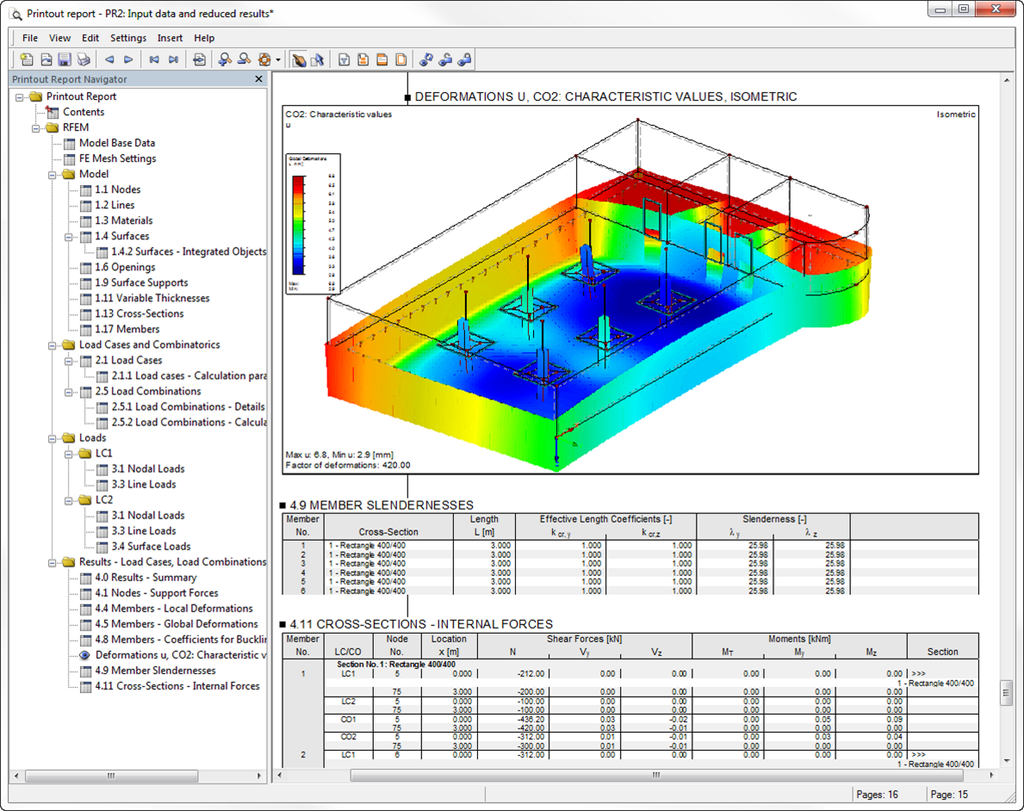
Printout Report Export in RTF or PDF File
Various languages are available for the results included in a printout report: English, German, French, Spanish, Italian, Czech, Slovak, Hungarian, Polish, Dutch, Portuguese, Russian, and Chinese. You can create further language versions individually.
It is possible to import additional texts as RTF files. Page numbering can be configured as well in order to use prefixes, for example. Furthermore, you can export the printout report as an RTF or PDF file as well as in VCmaster.

Management of Printout Report Scope
The extent of a printout report can be individually adjusted by means of selection criteria. You can create printout templates based on already existing printouts and reuse them globally for all design projects.


.png?mw=350&hash=7c41f3685ddd121325262761b82a9d868623fe4a)


![Reduction of Building to Cantilever Structure: The individual mass points represent the floors. The deflection due to the normal compression forces shown in (a) is (b) converted into equivalent moments of displacement or shear forces [2].](/en/webimage/009762/2420261/01-en-png-12-png.png?mw=350&hash=dd36dc43123116724231958668ad6cdcb13a0169)


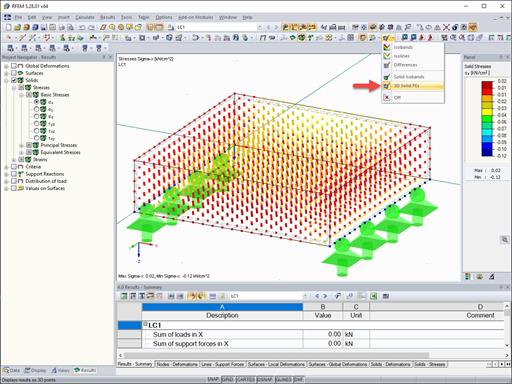
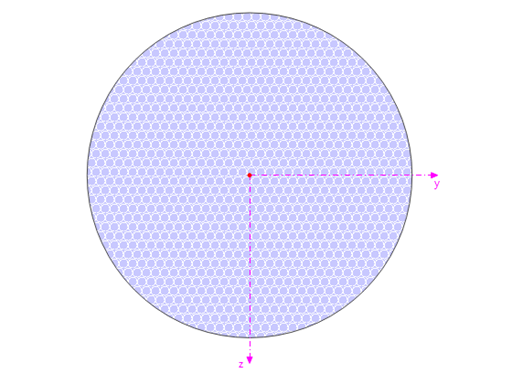
The results of solid stresses can be displayed as colored 3D points in the finite elements.
.png?mw=512&hash=ea9bf0ab53a4fb0da5c4ed81d32d53360ab2820c)
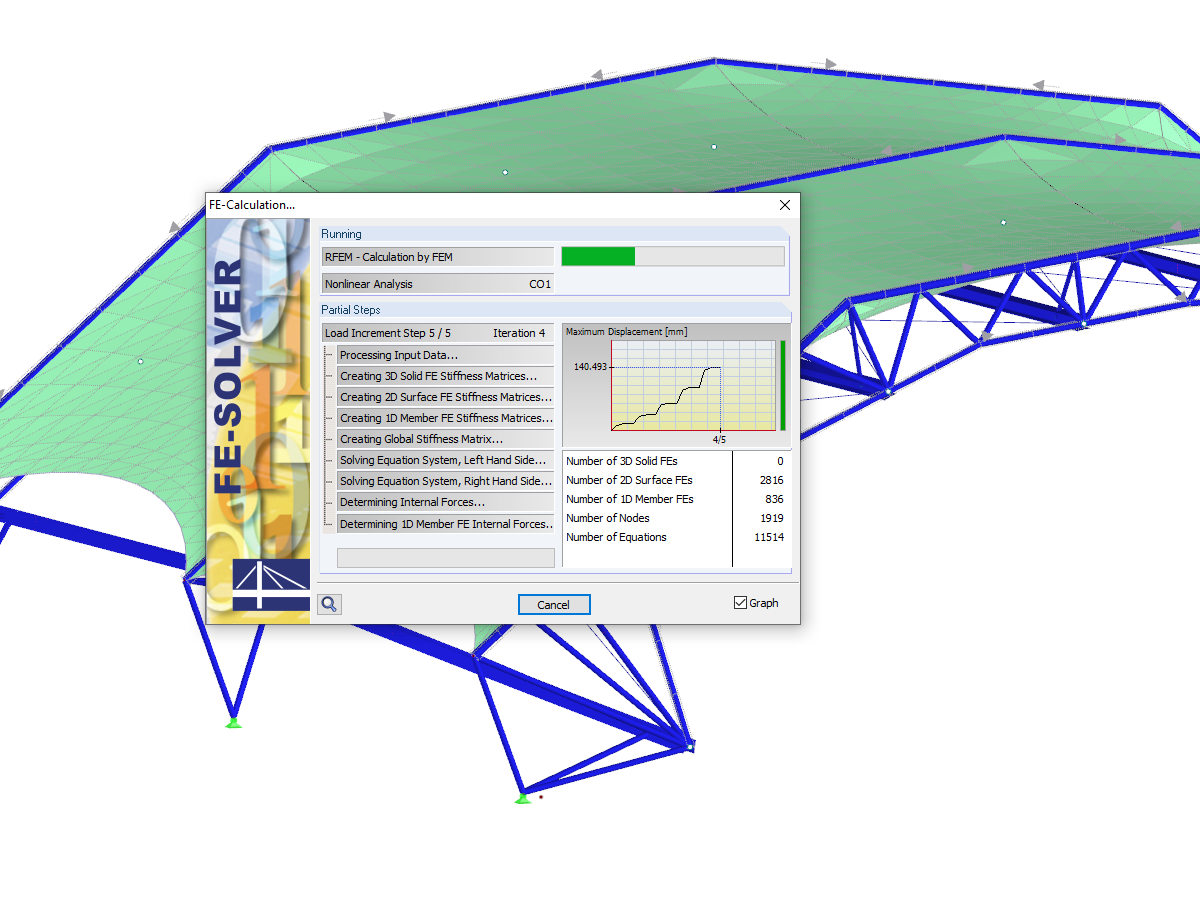
The number of degrees of freedom in a node is no longer a global calculation parameter in RFEM (6 degrees of freedom for each mesh node in 3D models, 7 degrees of freedom for the warping torsion analysis). Thus, each node is generally considered with a different number of degrees of freedom, which leads to a variable number of equations in the calculation.
This modification speeds up the calculation, especially for models where a significant reduction of the system could be achieved (for example, trusses and membrane structures).

Display extended strains of members, surfaces, and solids (for example, the important principal strains, equivalent total strains, and so on) in the Project Navigator - Results in RFEM as well as in Table 4.0.
For example, you can display governing plastic strains when performing the plastic design of connections with surface elements.

RFEM and RSTAB models can be saved as 3D glTF models (*.glb and *.glTF formats). View the models in 3D in detail with a 3D viewer from Google or Babylon. Take your VR glasses, such as Oculus, to "walk" through the structure.
You can integrate the 3D glTF models into your own websites using JavaScript according to these instructions (as on the Dlubal website Models to Download).
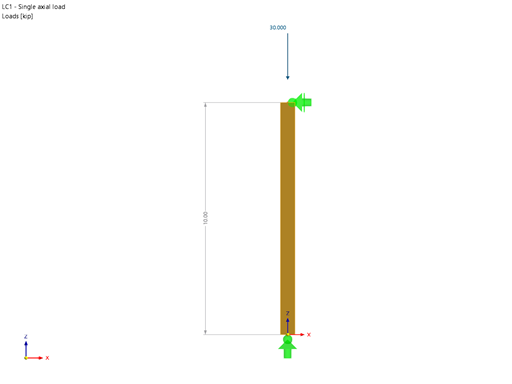
For example, can I define a member that absorbs all internal forces, except for the compressive axial forces?


.jpg?mw=350&hash=8f312d6c75a747d88bf9d0f5b1038595900b96c1)
