2023-08-25
042351
RFEM 6
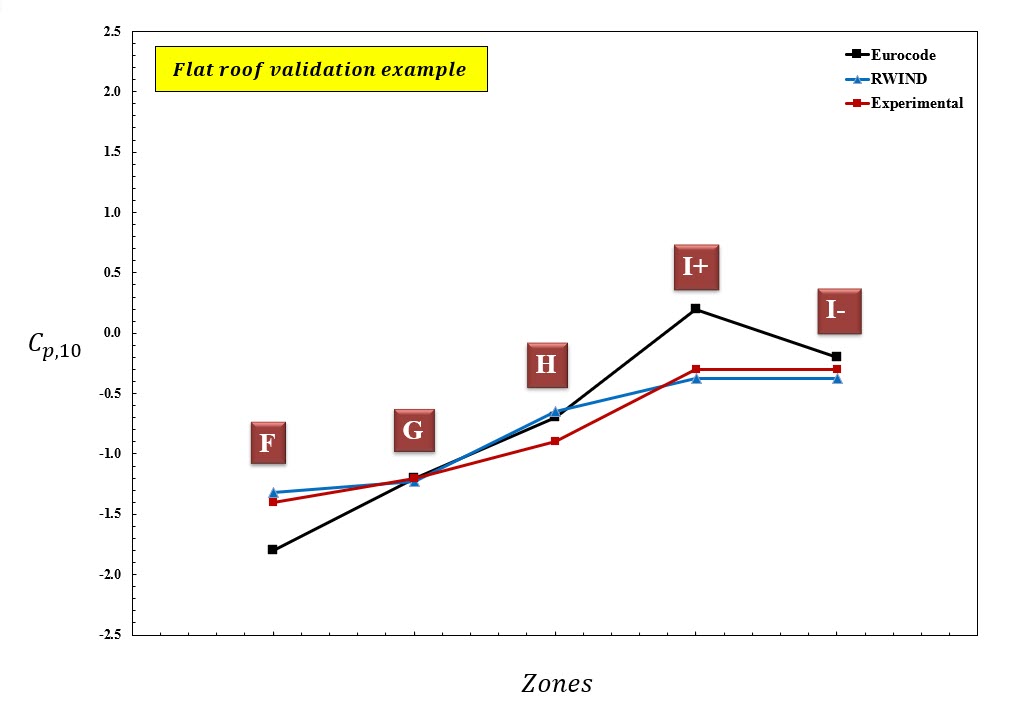
Figure 3: The Diagram of Cp,10 Value for Different Wind Zones and Terrain 2 Turbulence Intensity
Used in
Validation Example for C
p,10
and C
p,1
Value of Flat Roof (Sharp Eaves) with Comparison to EN 1991-1-4 and Japanese Wind Tunnel Data Base
Share
Copy