
2025-01-15
054963
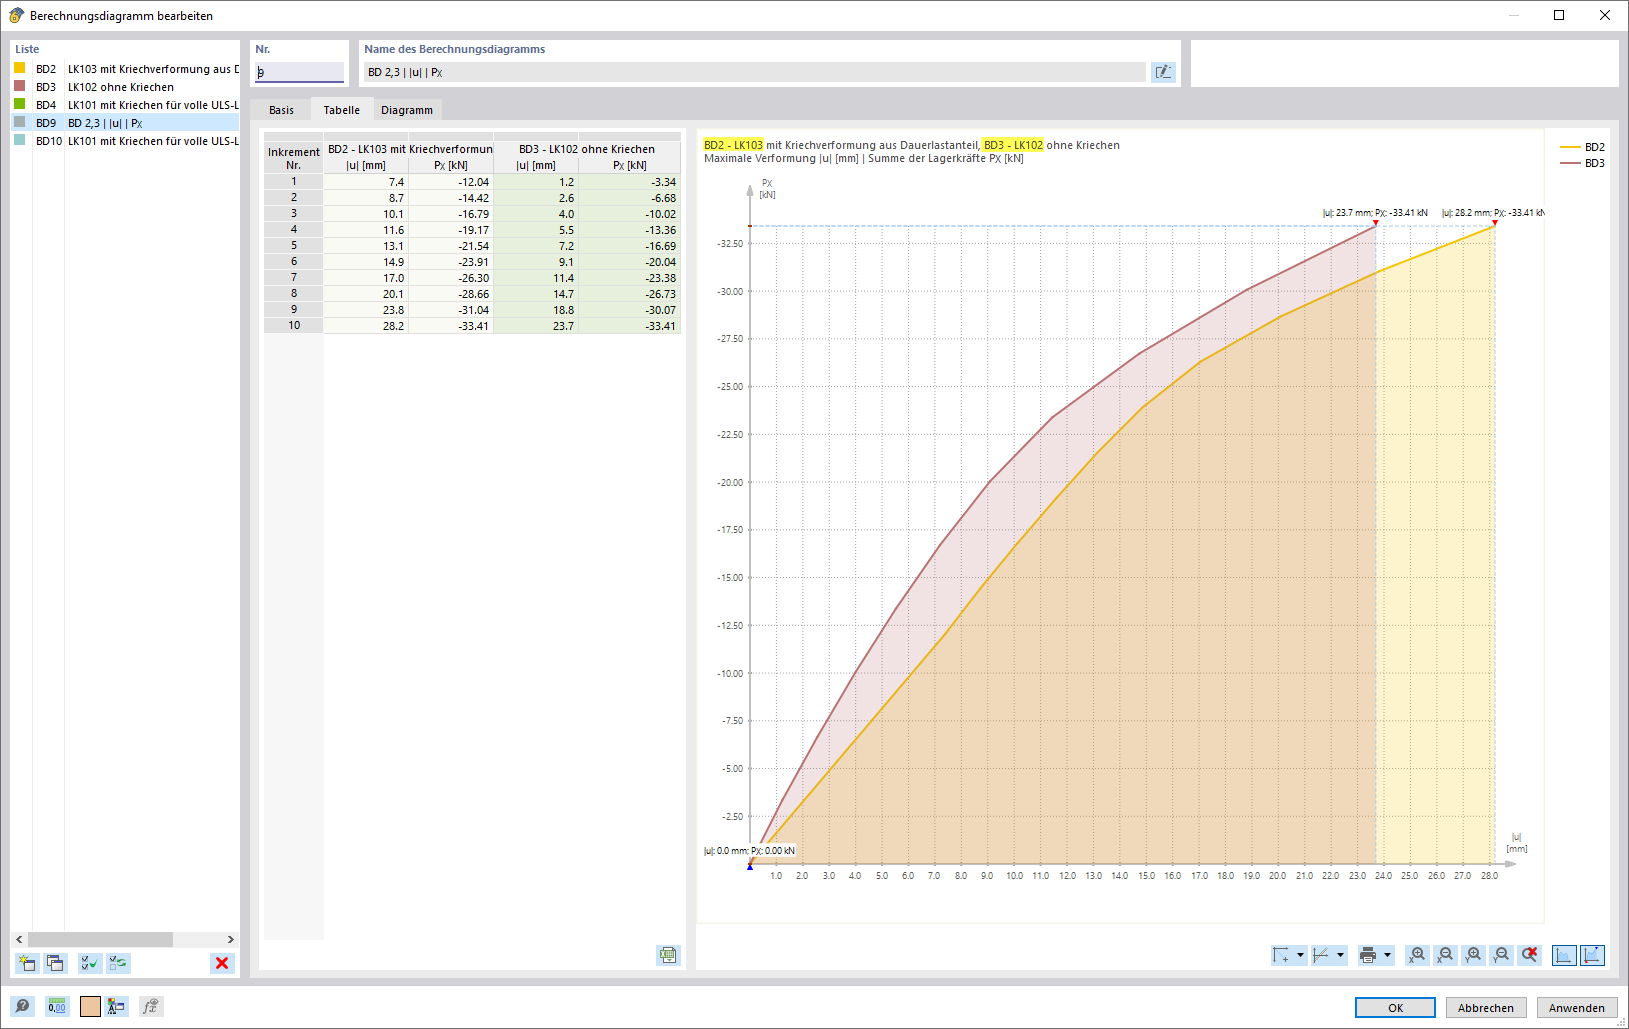
Nonlinear Result Analysis | Calculation Diagram
Diagram for displaying nonlinear analysis results | Load history, Creep, Static loading
The diagram visualizes the results of a nonlinear analysis that accounts for creep effects in addition to structural load components. The various curved lines represent the distribution of loads and structural reactions. The display allows for a precise interpretation of material deformations and nonlinear effects.