
2025-02-27
055565
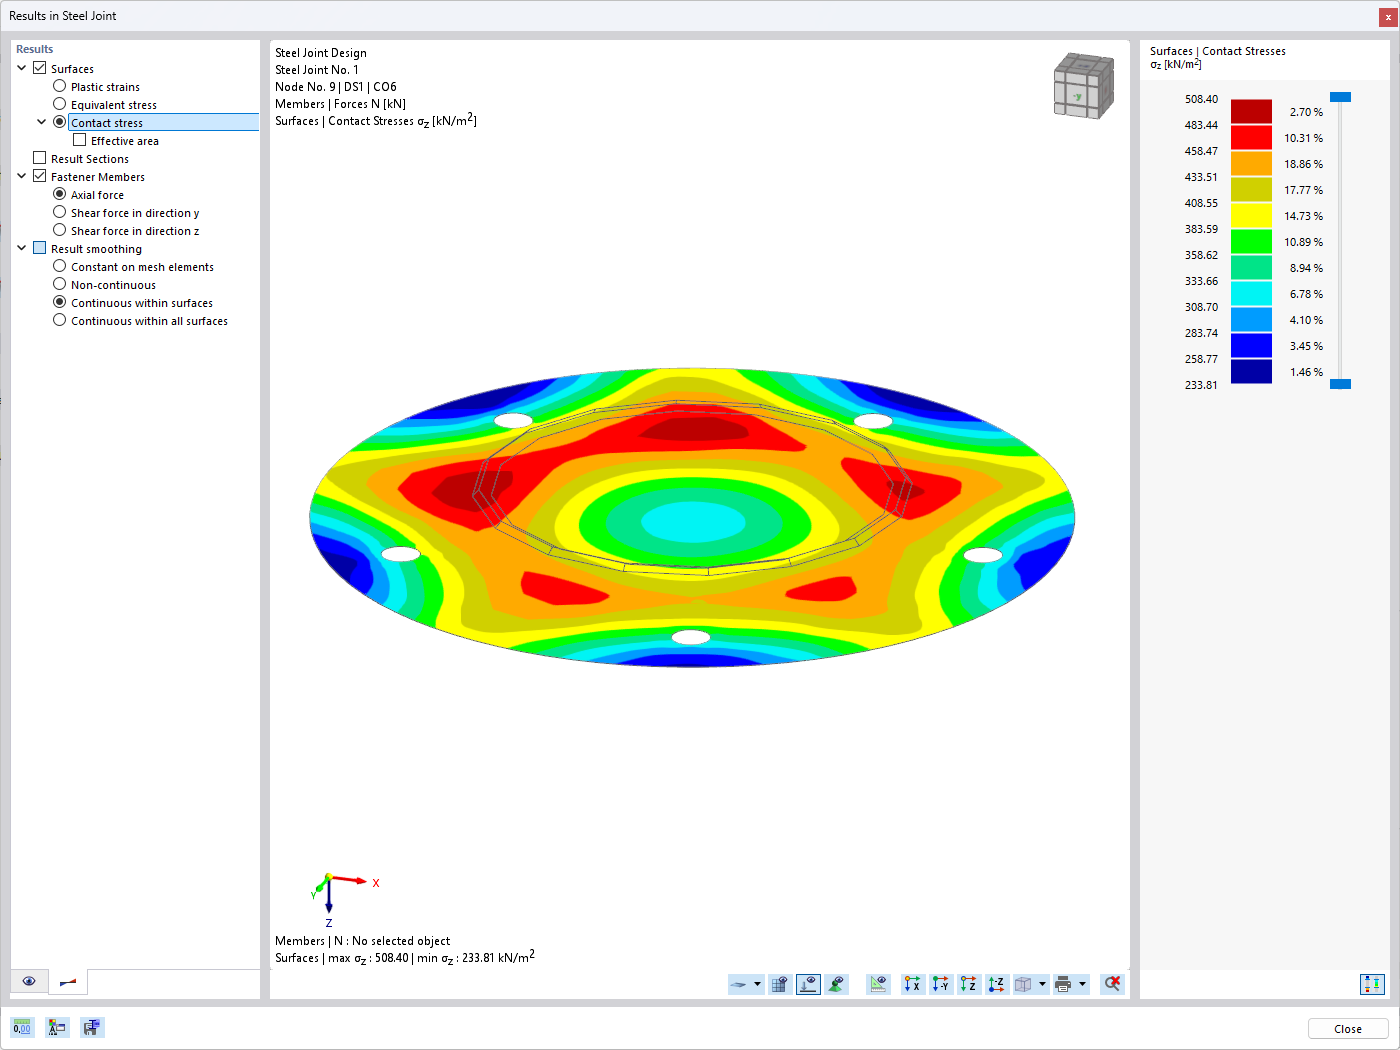
Output of Contact Stress Under Base Plate
Color-Coded Numerical Values of Stress Distribution on Underside of Base Plate
The graphic shows a color-coded display of the contact stresses on the bottom side of a base plate. Numerical values are modeled to show the stress distribution and its intensity along the foundation area. A legend assigns the color gradient to the respective stress ranges. The image illustrates the simulation of the loads transferred to the base plate.