
2025-05-03
056553
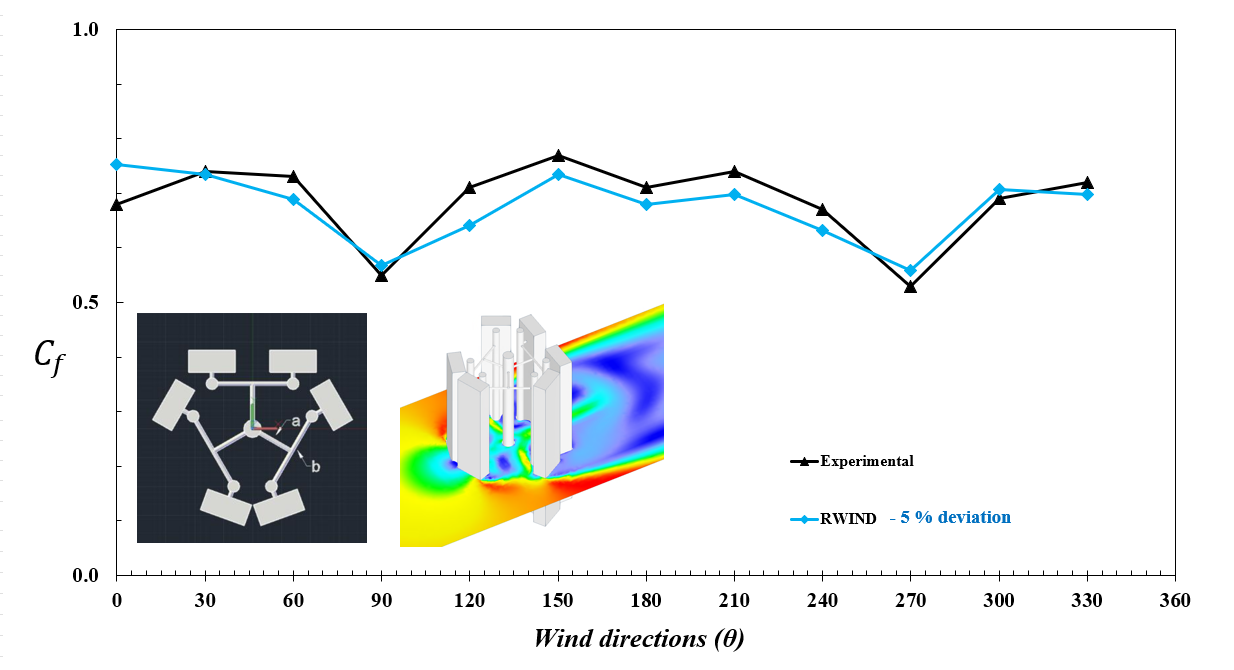
Comparison of Wind Force Coefficient between RWIND and Experimental Data
Graph illustrating wind force coefficient comparison between RWIND simulation and experimental measurement. Accurate evaluation of aerodynamic performance.
The image presents a graphical comparison of wind force coefficients obtained from RWIND simulation and experimental data. The graph visually contrasts the aerodynamic performance evaluated through computational and physical methods. It highlights the alignment and discrepancies between the data sets, showcasing RWIND's predictive capabilities.