
2025-08-12
058331
KB 1976 | Single Element Test – Comparison of Test Curves from Literature and Simulation
KB 1976 | Single element test – comparison of the test curves from literature and the simulation
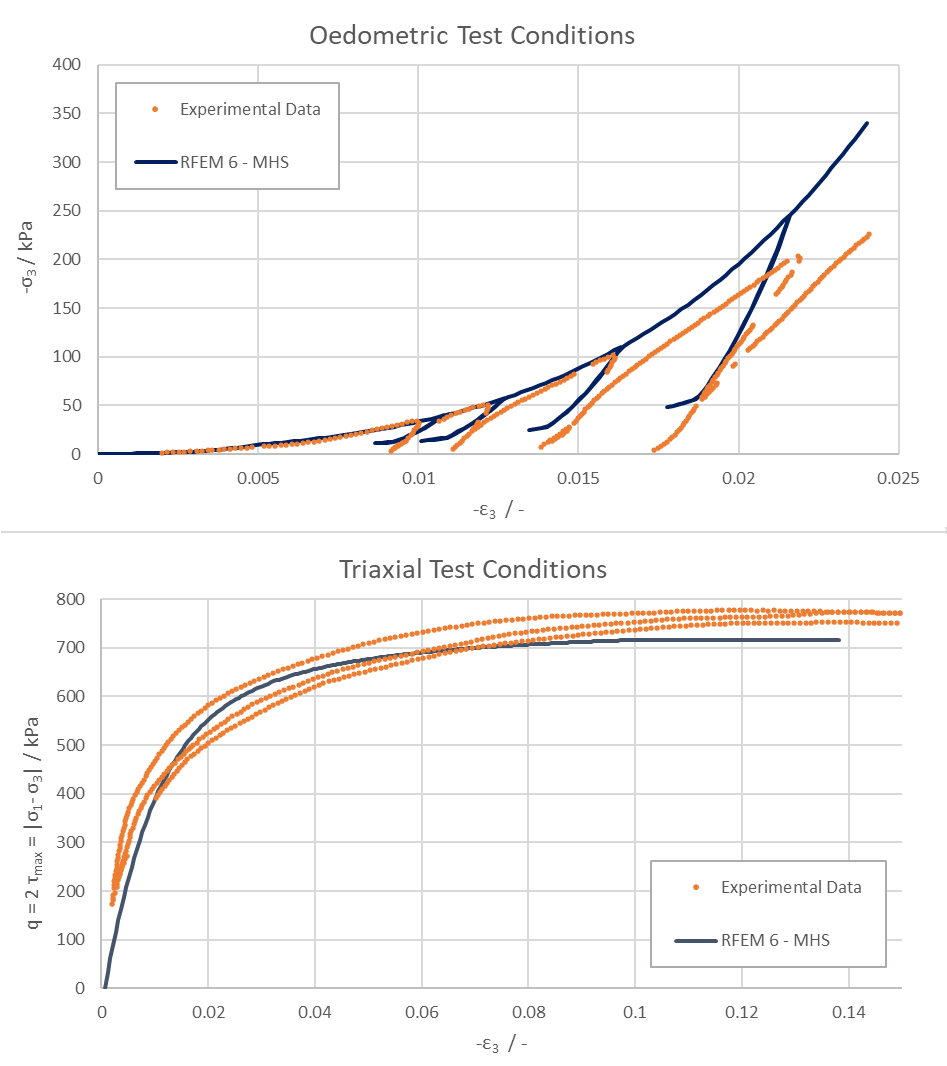
The image shows two diagrams comparing the published experimental data with the data obtained by adjusting the material parameters using RFEM 6.
The upper diagram shows the results for oedometric conditions. Here, the minimum principal normal stress and strain are shown opposite each other.
The lower diagram shows the relation between shear and vertical strain for triaxial conditions.
3D Model
More About 3D Model
Specifications
| Number of Nodes | 8 |
| Number of Lines | 12 |
| Number of Members | 0 |
| Number of Surfaces | 6 |
| Number of Solids | 1 |
| Number of Load Cases | 5 |
| Number of Load Combinations | 13 |
| Number of Result Combinations | 1 |
| Total Weight | 0,000 t |
| Dimensions (Metric) | 1,000 x 1,000 x 1,000 m |
| Dimensions (Imperial) | 3.28 x 3.28 x 3.28 feet |