
2025-12-13
060651
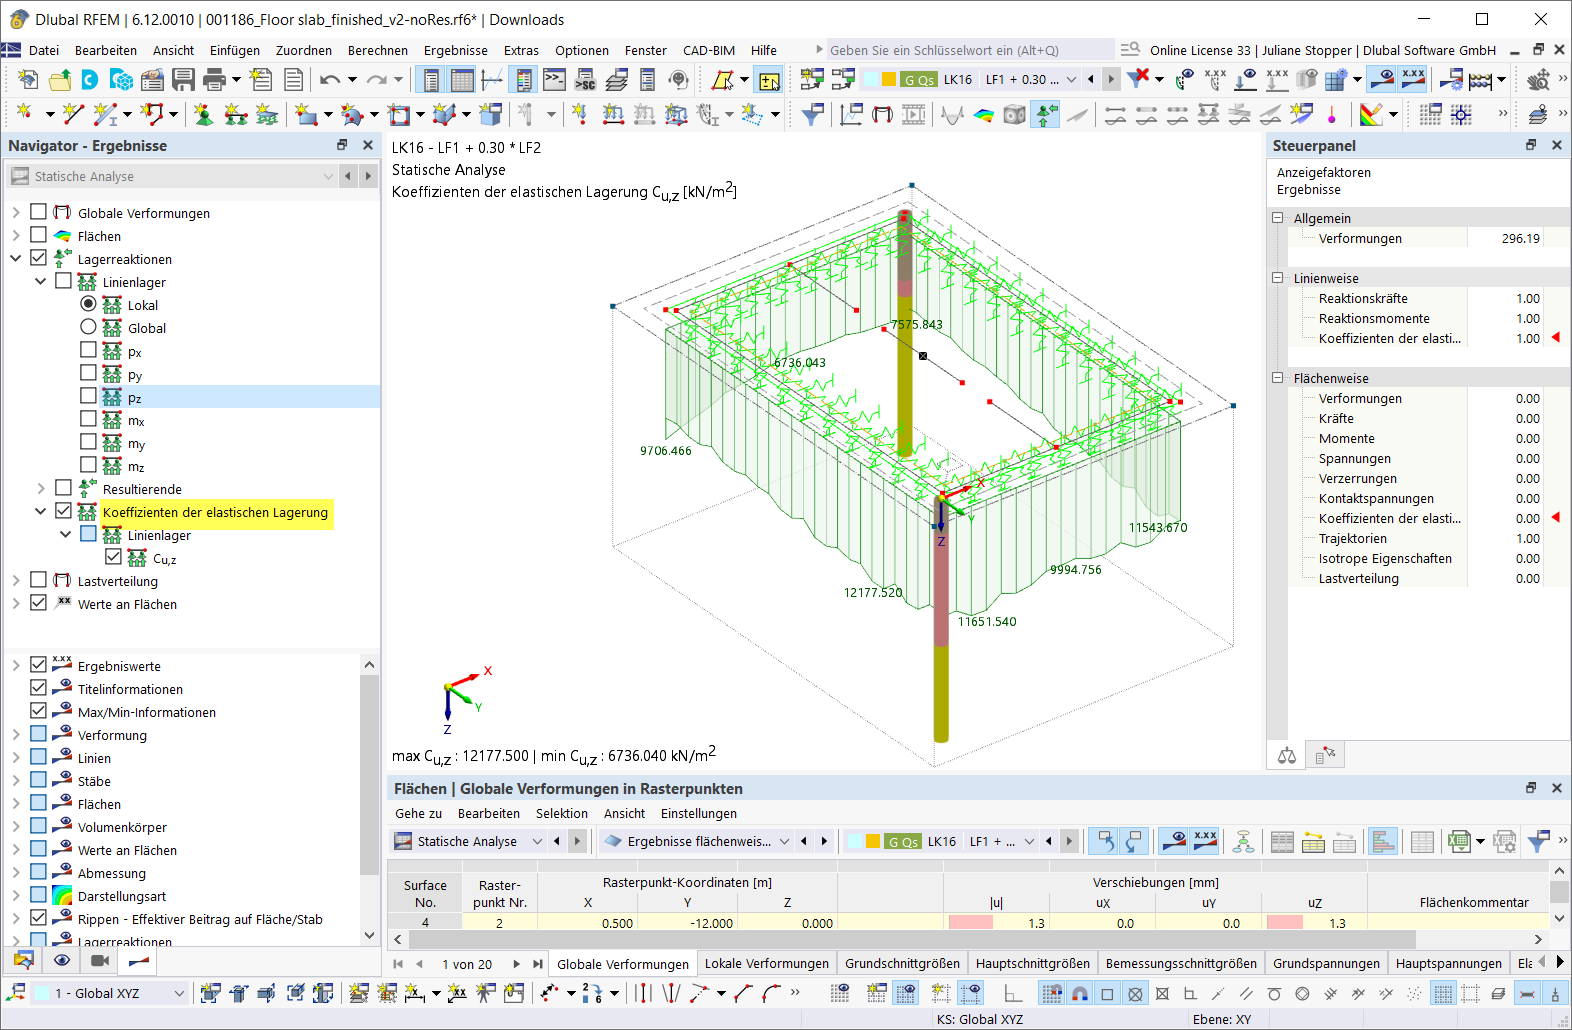
Graphical Display of Coefficients for Supplied Boundary Lines
Visualization of the support coefficients calculated by the constrained modulus method at the edges of a structure.
The image shows a graphical display of the support coefficients at the edges of a structure, which were determined using the constrained modulus method. This method is used to analyze and optimize the distribution of forces and stresses within the structure. The display helps engineers to identify critical areas and better understand the structural behavior.