
2026-03-26
062007
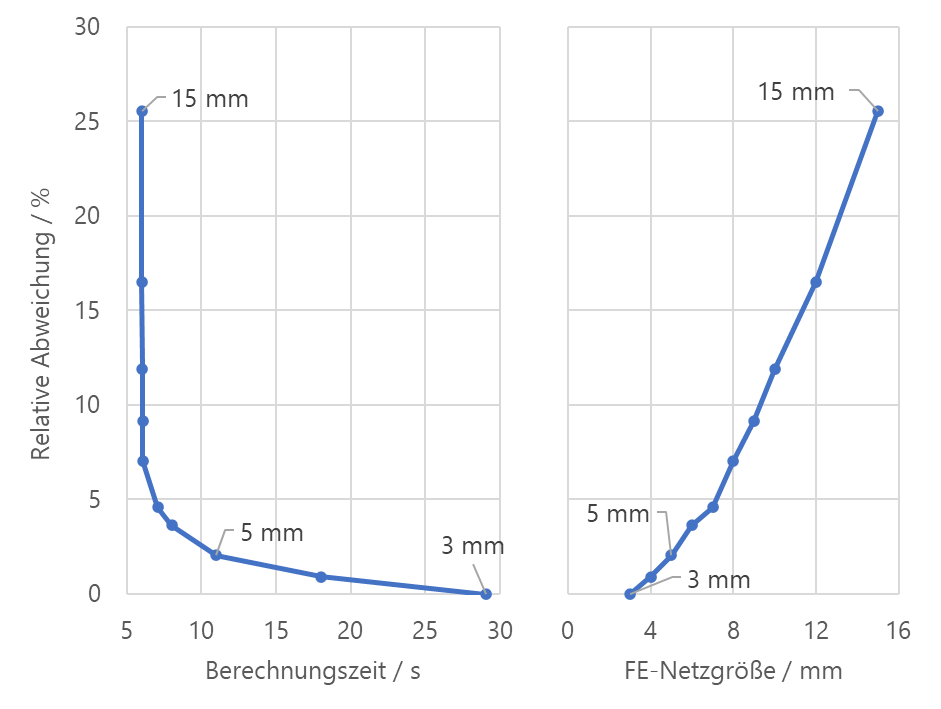
Relative Deviation of Critical Load from Its Minimum Value as Function of Calculation Time and Mesh Size
Relative deviation of the critical load from its minimum value as a function of the calculation time and mesh size
This image shows the results of a mesh convergence study analyzing the critical load of an aluminum shell with different mesh sizes. The image displays the deviation of the critical load from the result of the finest mesh analyzed as a function of computation time (left) and mesh size (right).
Used in
3D Model
Specifications
| Number of Nodes | 6 |
| Number of Lines | 7 |
| Number of Members | 1 |
| Number of Surfaces | 3 |
| Number of Solids | 0 |
| Number of Load Cases | 1 |
| Number of Load Combinations | 0 |
| Number of Result Combinations | 0 |
| Total Weight | 0.001 t |
| Dimensions (Metric) | 1.050 x 0.200 x 0.100 m |
| Dimensions (Imperial) | 3.44 x 0.66 x 0.33 feet |