Answer:
The result colors of member components have been adjusted to the multicolor display of the surface results. The multicolor display is based on a color spectrum that runs from blue to red. Blue represents the minimum and red the maximum. Similarly, the two-color member result display now shows the negative values in blue and the positive values in red. When switching to the multicolored member result display, this logic also applies, and the small (negative) values remain in the lower blue segment of the spectrum while the large (positive) values are in the upper red segment of the spectrum.
Colors for Compression and Tension
What is the reason for changing the colors for compression and tension in RFEM 6 and RSTAB 9 with respect to previous program versions? Since that time, compression has been red and tension has been blue.

Do you have any questions?


Length: 00:02:14 min

Length: 00:00:34 min

Length: 00:00:41 min

Length: 00:24:11 min

Length: 00:01:52 min
Length: 00:00:37 min
Length: 00:01:22 min

Length: 00:02:00 min
Length: 00:36:28 min


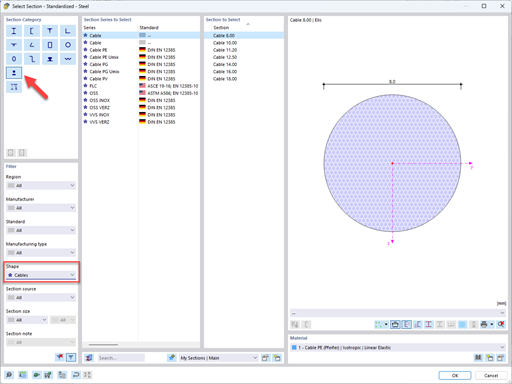
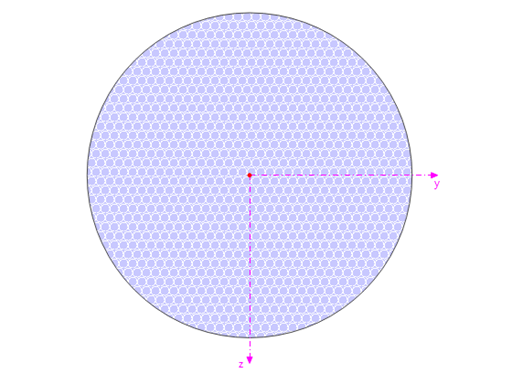
In this article, you will learn how to model and design cable structures in RFEM 6 or RSTAB 9.
This article describes and explains the influence of bending stiffness of cables on their internal forces. Furthermore, the text provides information on how this influence can be reduced.
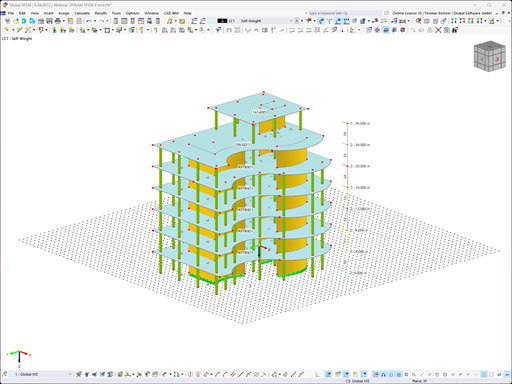
To evaluate whether it is also necessary to consider the second-order analysis in a dynamic calculation, the sensitivity coefficient of interstory drift θ is provided in EN 1998‑1, Sections 2.2.2 and 4.4.2.2. It can be calculated and analyzed using RFEM 6 and RSTAB 9.
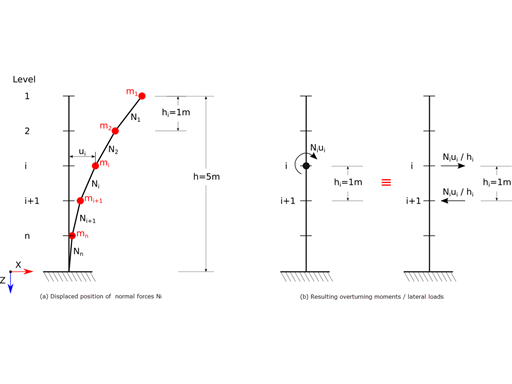
For the ultimate limit state design, EN 1998‑1, Sections 2.2.2 and 4.4.2.2 require a calculation considering the second‑order theory (P‑Δ effect). This effect may be neglected only if the interstory drift sensitivity coefficient θ is less than 0.1.


The "Bracing in Cells" function allows you to generate diagonal bracing with just a few clicks. You can find this feature under Tools → Generate Model – Members → Bracing in Cells.

In RFEM and RSTAB, you can visualize the flow field quantities of pressure, velocity, turbulence kinetic energy, and turbulence dissipation rate for the wind simulation.
The clipping planes are aligned with the respective wind direction.

Are you looking for a formula relevant for your structural design? Just ask our AI chatbot Mia!
Mia shows you the right formula, with explanations, if necessary.
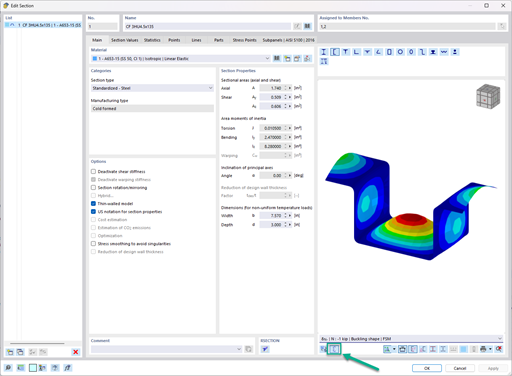
In the "Edit Section" dialog box, you can display the buckling shapes of the Finite Strip Method (FSM) as a 3D graphic.
I would like to start a cloud calculation. However, I get the error message "File upload failed with error SSL handshake failed." displayed. What is the problem?
How can I reduce the calculation time for members with a nonlinear material model in RFEM 6 and RSTAB 9?
Is it possible to use SHAPE-THIN 9 files in RFEM 6 and RSTAB 9?
I have purchased a new add-on. Where can I find the installation file for this?
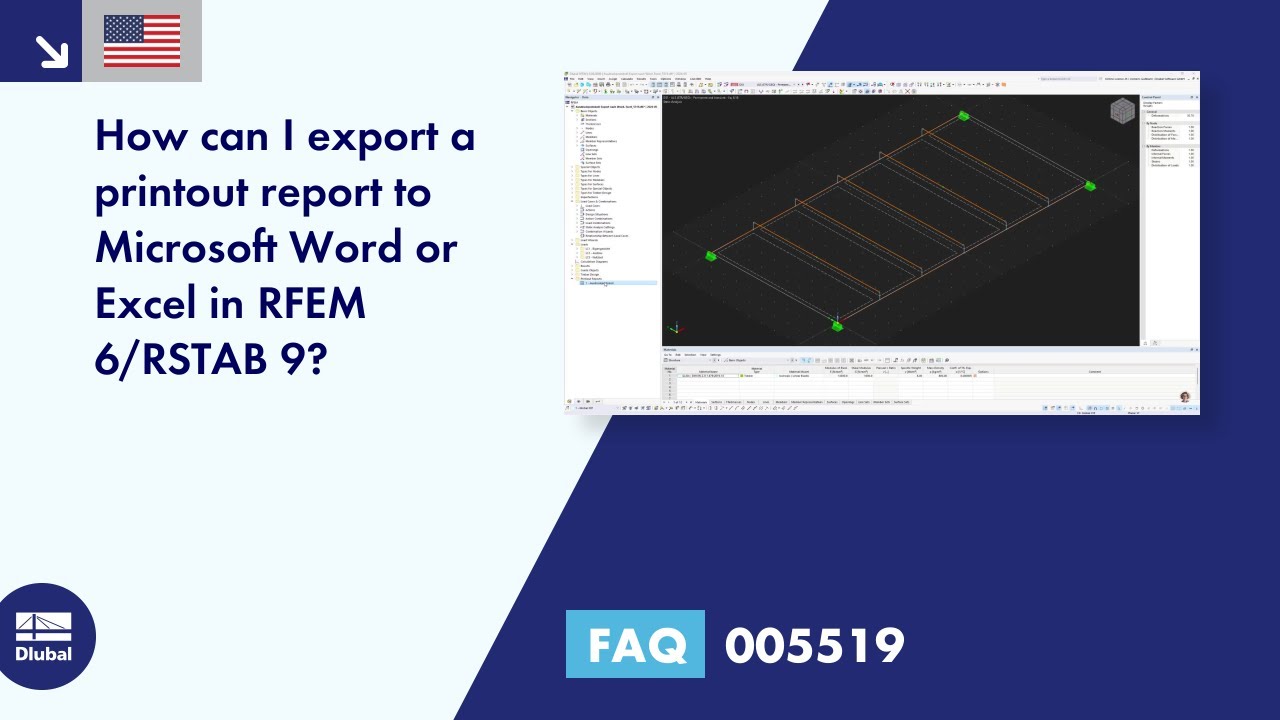
How can I export a printout report to Microsoft Word or Excel in RFEM 6 / RSTAB 9?
Where can I subsequently reverse the global axis system in RFEM 6 (direction of the global Z-axis)?


