


Description
In the current validation example, the wind pressure coefficients (Cp) are investigated for both primary structural components and secondary elements, such as cladding and facade systems. The analysis is based on the Canadian wind load standard (NBC 2020) [1] and the Japanese Wind Tunnel Database for a low-rise building with a 45-degree roof slope. The recommended simulation settings for a three-dimensional low-rise building with this roof configuration will be presented in the following section.
A key aspect of CFD simulation is identifying the most compatible configuration parameters that align with wind load standards. These include input data such as turbulence models, wind velocity and turbulence intensity profiles, boundary layer conditions, discretization order, and other numerical settings. However, it is important to note that the existing standards generally do not provide sufficient guidance for CFD-specific parameters. In the current validation example, we have demonstrated a set of RWIND configurations that are highly compatible with both the NBC 2020 low-rise building case (with a 45-degree roof slope) and experimental results from the Japanese Wind Tunnel Database.
Analytical Solution and Results
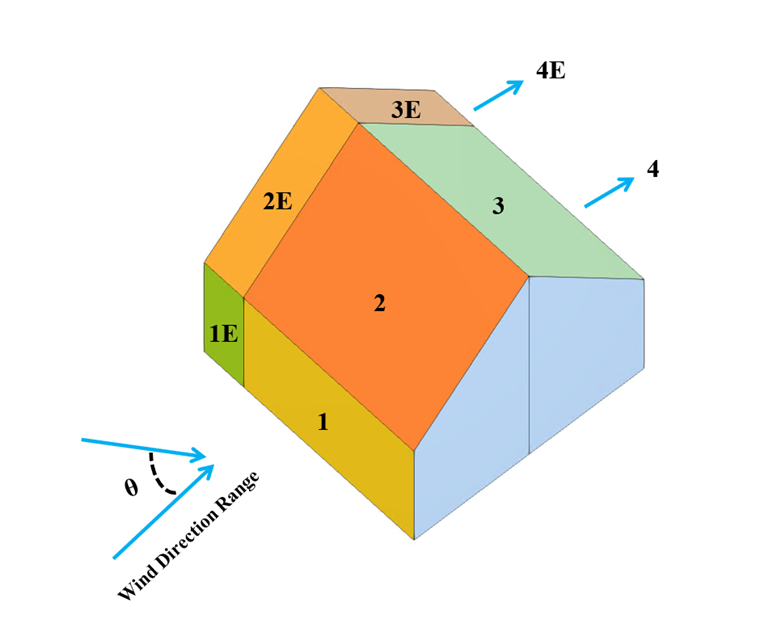
The sharp-edged eaves model used in the study, as shown in Figure 1, includes eight zones (1, 1E, 2, 2E, 3, 3E, 4, 4E). The external wind pressure coefficients for both global and local areas of low-rise buildings with a 45-degree roof slope are presented in Figure 4.1.7.6.-A and Table 4.1.7.6. of NBC 2020. The key assumptions and input parameters used in the RWIND numerical CFD simulation are summarized in Table 1.
| Table 1: Dimensional Ratio and Input Data | |||
| Basic Wind Velocity | V | 22 | m/s |
| Terrain Category | 2 | - | - |
| Crosswind Dimension | b | 16 | m |
| Along-Wind Dimension | d | 16 | m |
| Mean Roof Height | href | 12 | m |
| Roof Angle | θroof | 45 | Degree |
| Air Density - RWIND | ρ | 1.25 | kg/m3 |
| Wind Directions | θwind | 0, 22.5, 30, 45 | Degree |
| Turbulence Model - RWIND | Steady RANS k-ω SST | - | - |
| Kinematic Viscosity (Equation 7.15, EN 1991-1-4) - RWIND | ν | 1.5*10-5 | m2/s |
| Scheme Order - RWIND | Second | - | - |
| Residual Target Value - RWIND | 10-4 | - | - |
| Residual Type - RWIND | Pressure | - | - |
| Minimum Number of Iterations - RWIND | 800 | - | - |
| Boundary Layer - RWIND | NL | 10 | - |
| Type of Wall Function - RWIND | Enhanced / Blended | - | - |
| Turbulence Intensity (Best Fit) - RWIND | I | Terrain 2 | - |
Global and local wind pressure coefficients are calculated for all zones, taking into account wind velocity and turbulence intensity profiles based on Terrain Category 2. Additionally, four wind directions (θ = 0, 22.5, 30, 45 degrees) are considered to determine the corresponding global Cp values in accordance with NBC 2020 and the Japanese Wind Tunnel Database.
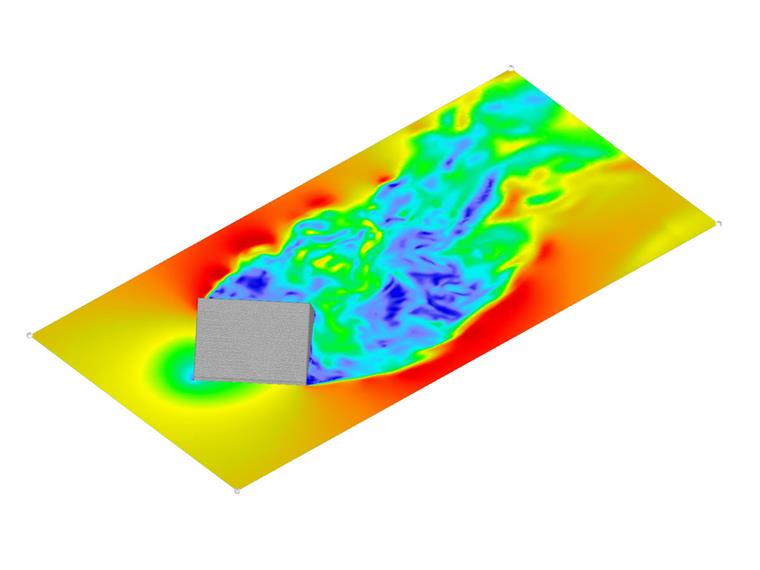
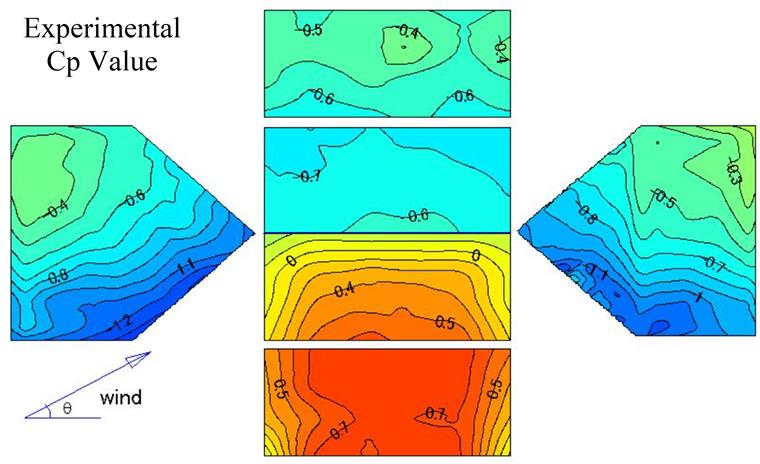
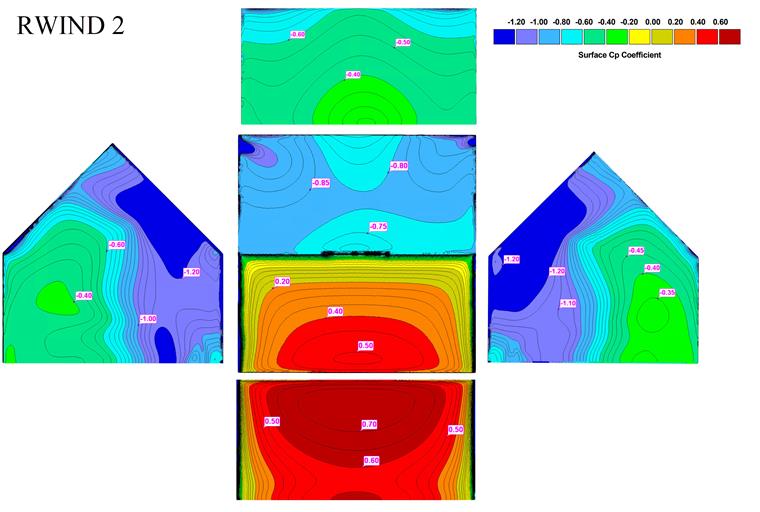
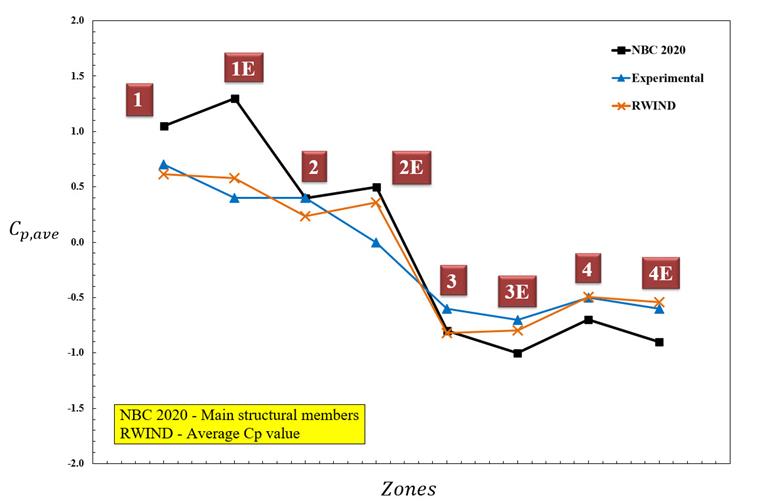
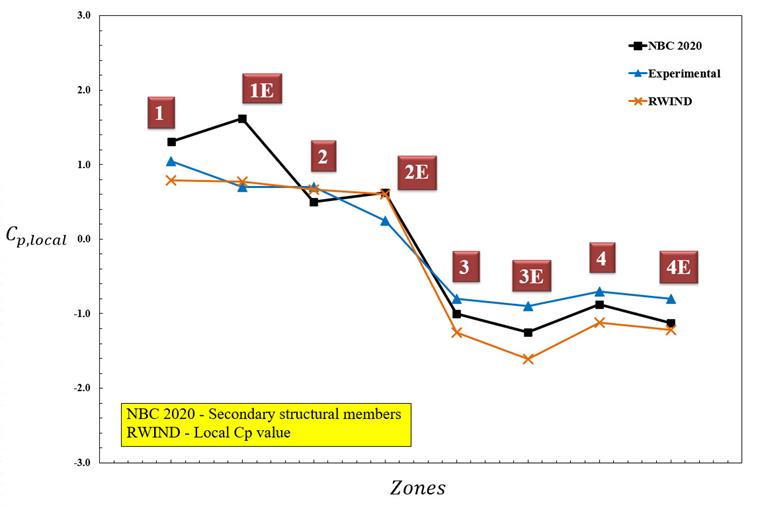
The wind velocity profile and global Cp contours from both the experimental data and the RWIND numerical simulation are shown in Figures 2, 3, and 4. These figures also compare the global and local Cp values for primary and secondary structural members with the Japanese wind tunnel test results and RWIND 2 simulation. Furthermore, Figures 5 and 6 present comparative diagrams of Cp,ave, and Cp,local values across eight building zones for the experimental study, NBC 2020, and RWIND simulation of the low-rise building with a 45-degree roof slope.
The experimental Cp values were manually extracted from average and RMS pressure contour plots available in the Japanese Wind Tunnel Database.
The wind velocity and turbulence profiles in RWIND are configured using Terrain Category 2, which incorporates height variations and aligns more accurately with validated reference data and design standards. It is important to note that the results of the steady-state simulation using RANS k-ω SST turbulence model, as applied in the current validation example, show good agreement with the experimental data in particular. The critical cases involve various wind directions with height-dependent turbulence intensity, as defined by Terrain Category 2. In the positive pressure zones, the deviation of the Cp values in both the numerical and experimental simulations is greater than in the NBC 2020 code. This suggests that NBC 2020 takes a very conservative approach for estimating positive pressure regions.
Conclusion
In the current validation example, we investigate the wind pressure coefficient (Cp) obtained from RWIND for both main structural design and secondary structural design, such as cladding or facade systems based on the Canadian wind load standard (NBC 2020) [1] and the Japanese Wind Tunnel Database for a low-rise building with 45-degree roof slope.
The results indicate that the recommended RWIND configuration aligns well with most zones in the Eurocode. The increased turbulence intensity associated with the height-dependent profile of Terrain Category 2 contributes to more accurate simulation outcomes. To capture the extreme values defined by NBC 2020, it is crucial to consider both critical wind conditions and transient simulations. The observed deviations are primarily due to safety factors and the statistical methodology used in the code, which results in a more conservative estimation particularly for positive Cp values when compared to other standards such as ASCE 7-22.
In addition, the flat roof model with recommended settings is available to download here: