L'Institut d'architecture du Japon (AIJ) a présenté un certain nombre de scénarios de référence bien connus de la simulation du vent.
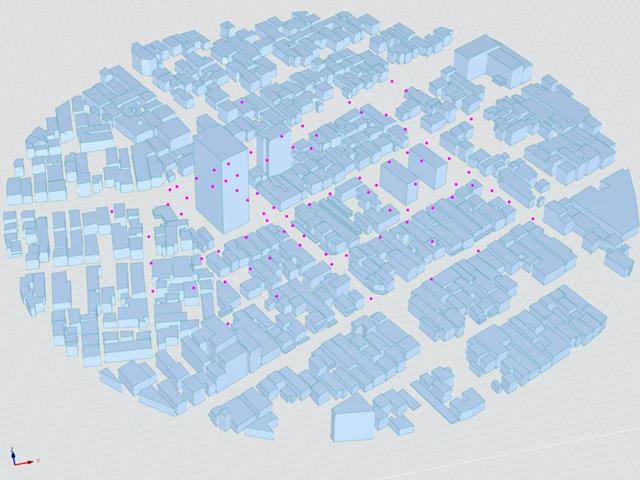
L'article suivant porte sur le « Cas E - un complexe immobilier dans une zone urbaine avec une forte concentration de bâtiments de faible hauteur dans la ville de Niigata ».
Le scénario décrit ci-dessous est simulé dans RWIND2 et les résultats sont comparés aux résultats simulés et expérimentaux de l'AIJ.
Das Architectural Institute of Japan (AIJ) hat eine Reihe an bekannten Benchmark-Szenarien für Windsimulation vorgestellt.
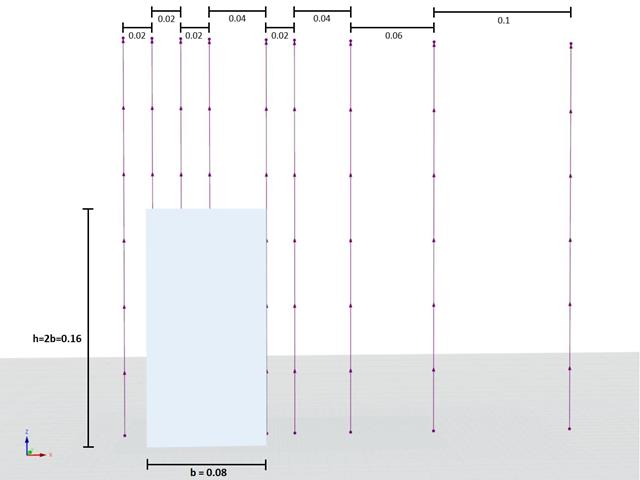
Der Nachfolgende Beitrag dreht sich dabei um den « Cas A - Immeuble de grande hauteur de forme 2:1:1 ».
Im Folgenden wird das beschriebene Szenario in RWIND2 nachgebildet und die Ergebnisse mit den simulierten und der experimentellen Resultate des AIJ verglichen.
L'Institut d'architecture du Japon (AIJ) a présenté un certain nombre de scénarios de référence bien connus de la simulation du vent.
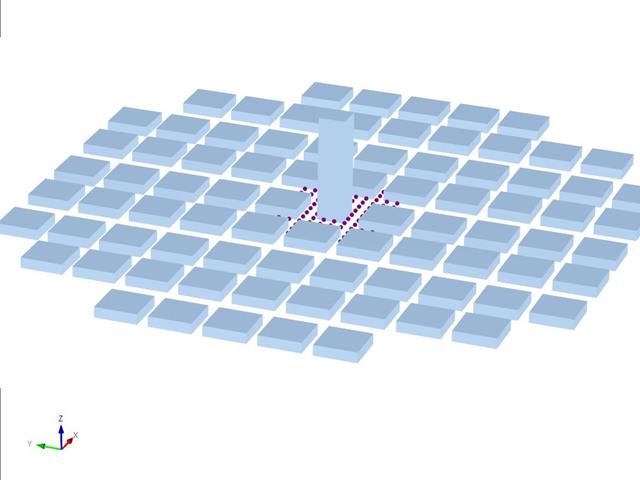
L'article suivant traite du « Cas D - Immeuble de grande hauteur entre des îlots urbains ».
Le scénario décrit ci-dessous est simulé dans RWIND2 et les résultats sont comparés aux résultats simulés et expérimentaux de l'AIJ.
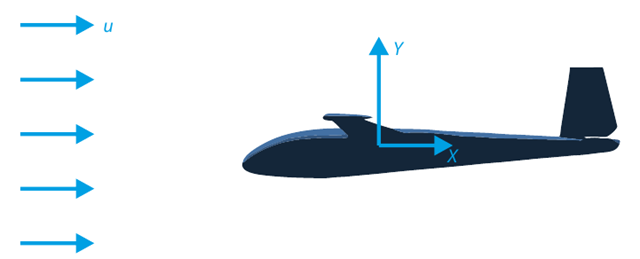
L'objectif de cet exemple de vérification est d'analyser l'écoulement des fluides autour d'un planeur. Cette tâche consiste à déterminer le coefficient de traînée et le coefficient de portance par rapport à l'angle d'attaque. Ces coefficients peuvent également être tracés dans le graphique de la courbe de traînée. L'angle limite pour l'écoulement laminaire du fluide autour du profil de l'aile peut également être déterminé à partir du champ de vitesse. Le modèle CAO 3D disponible (fichier STL) est utilisé dans RWIND 2.
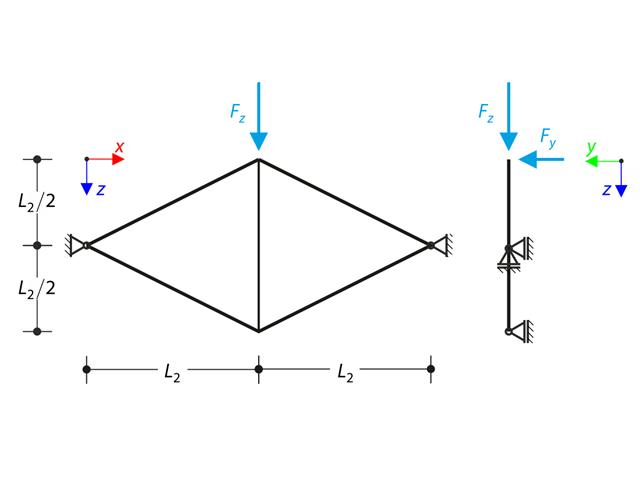
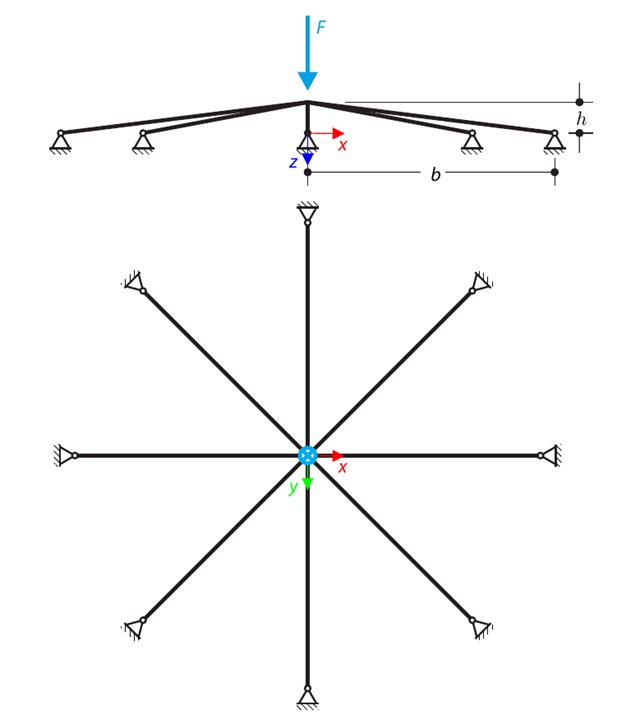
Un treillis plan composé de quatre barres inclinées et d'une barre verticale est chargé au niveau du nœud supérieur à l'aide d'une force verticale et d'une force hors du plan. Assuming the large deformation analysis and neglecting the self-weight, determine the normal forces of the members and the out-of-plane displacement of the upper node.
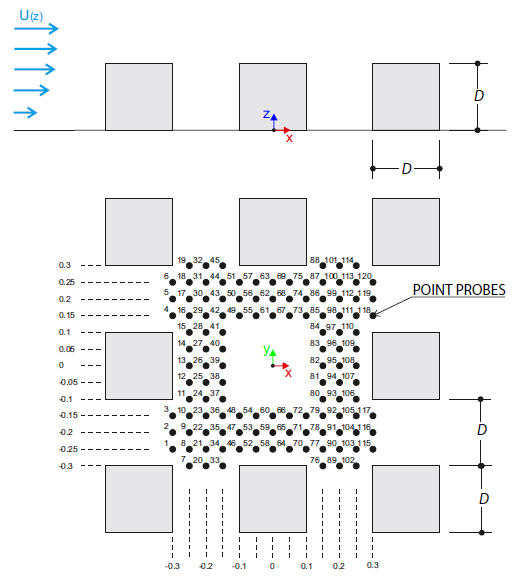
L'exemple de vérification décrit des charges de vent dans plusieurs directions du vent sur un modèle de groupe de bâtiments. Le modèle est composé de huit cubes. Les champs de vitesse obtenus par la simulation de RWIND sont comparés aux valeurs mesurées issues de l'expérience. Les données expérimentales sont mesurées à l'aide d'un anémomètre à thermistance dans la soufflerie.
Cet exemple de vérification compare le calcul des charges de vent sur un bâtiment avec une toiture à deux versants selon la norme ASCE 7-16 et celui de la simulation CFD dans RWIND Simulation. The building is defined according to the sketch and the inflow velocity profile taken from the ASCE 7-16 standard.
Cet exemple de vérification compare le calcul des charges de vent sur une toiture terrasse selon la norme ASCE 7-16 et celui de la simulation CFD dans RWIND Simulation. The building is defined according to the sketch and the inflow velocity profile taken from the ASCE 7-16 standard.
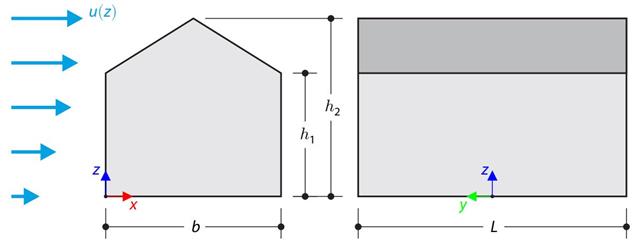
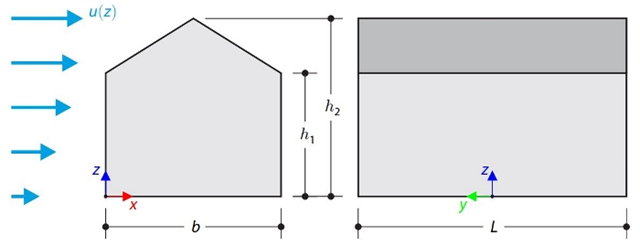
L'exemple de vérification compare le calcul de la charge de vent sur un bâtiment avec une toiture à deux versants à l'aide de la norme EN 1991-1-4 et de la simulation CFD dans RWIND Simulation. The building is defined according to the sketch, and the inflow velocity profile is taken according to the standard EN 1991-1-4.
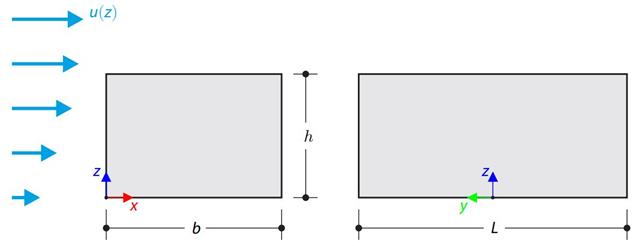
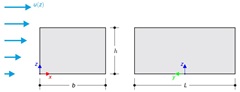
The verification example compares wind load calculation on a building with a flat roof using the standard EN 1991-1-4 and using CFD simulation in RWIND Simulation. Le bâtiment est défini d'après le croquis et le profil de vitesse d'afflux est calculé selon la norme EN 1991-1-4.
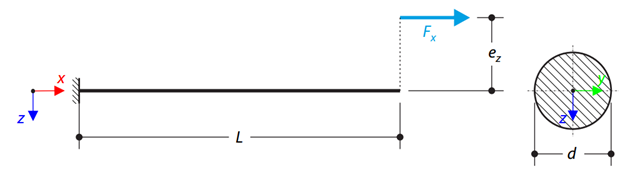
Une force axiale excentrée s'exerce sur une console constituée d'une barre arrondie. Determine the maximum vertical deflection of the console using the geometrically linear and second-order analysis.
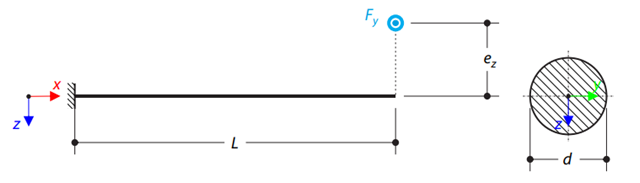
Une force transversale excentrée s'exerce sur une console constituée d'une barre ronde. Determine the maximum deflection and maximum twist of the console using the geometrically linear analysis.
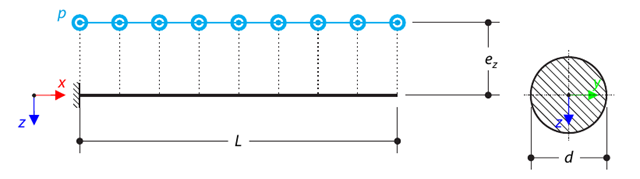
Une charge excentrique uniforme s'exerce sur une console constituée d'une barre ronde. Determine the maximum deflection and maximum twist of the console using the geometrically linear analysis.
A symmetrical shallow structure is made of eight equal truss members, which are embedded into hinge supports. The structure is loaded by a concentrated force and alternatively by imposed nodal deformation over the critical limit point when the snap-through occurs. Imposed nodal deformation is used in RFEM 5 and RSTAB 8 to obtain the full equilibrium path of the snap-through. Le poids propre est négligé dans cet exemple. Determine the relationship between the actual loading force and the deflection, considering large deformation analysis. Evaluate the load factor at the given deflections.
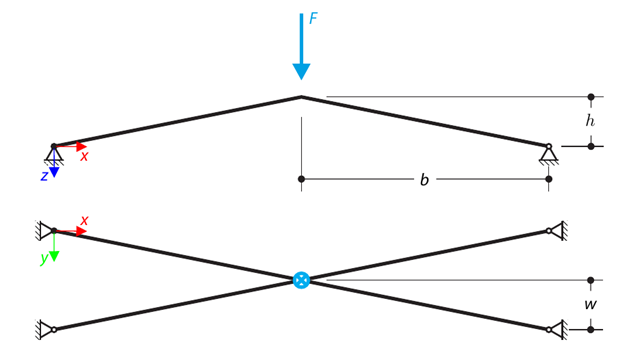
A structure is made of four truss members, which are embedded into hinge supports. The structure is loaded by a concentrated force and alternatively by imposed nodal deformation over the critical limit point, when snap-through occurs. Imposed nodal deformation is used in RFEM 5 and RSTAB 8 to obtain the full equilibrium path of the snap-through. Le poids propre est négligé dans cet exemple. Determine the relationship between the actual loading force and the deflection, considering large deformation analysis. Evaluate the load factor at given deflections.
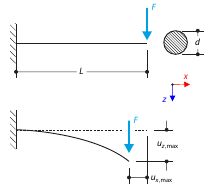
Une console est chargée par une force concentrée à son extrémité libre. Determine the maximum deflection of the console using large deformation analysis.
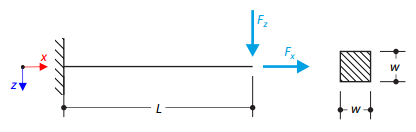
Un porte-à-faux est chargé par une force transversale et un effort normal à l'extrémité droite et est entièrement encastré à l'extrémité gauche. The problem is described by the following set of parameters. The problem is solved by using the geometrically linear analysis, second-order analysis, and large deformation analysis.
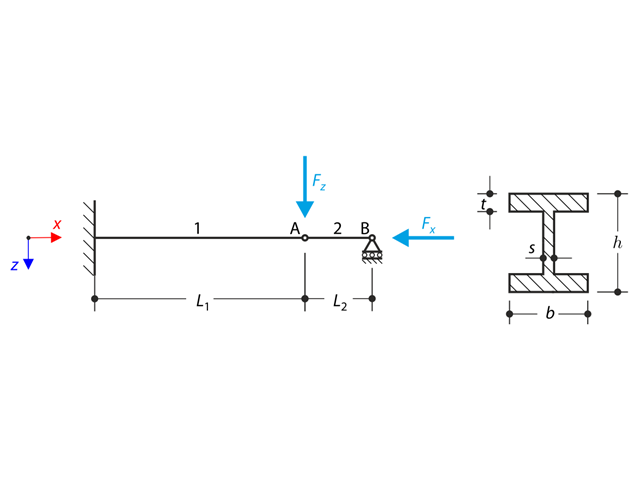
A structure made of an I-profile is fully fixed on the left end and embedded into the sliding support on the right end. The structure consists of two segments. Le poids propre est négligé dans cet exemple. Determine the maximum deflection of the structure, the bending moment on the fixed end, the rotation of segment 2, and the reaction force at point B by means of the geometrically linear analysis and the second-order analysis. The verification example is based on the example introduced by Gensichen and Lumpe.
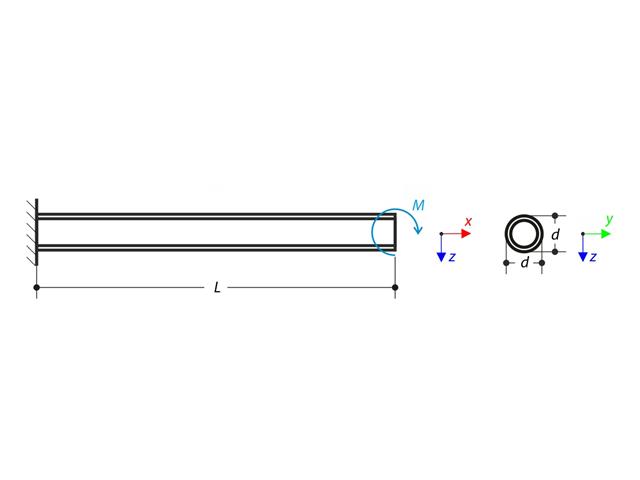
Un porte-à-faux est chargé par un moment à son extrémité libre. Using the geometrically linear analysis and large deformation analysis, and neglecting the beam's self-weight, determine the maximum deflections at the free end. The verification example is based on the example introduced by Gensichen and Lumpe.
Analyse de l'historique de temps d'une poutre en porte-à-faux (système SDOF) activée par une fonction périodique. Vertical deformations and accelerations calculated with direct integration and modal analysis in RF‑/DYNAM Pro - Forced Vibrations are compared with the analytical solution.
Un câble en acier ou une membrane avec des axes aux deux extrémités est chargé par une charge distribuée. Neglecting its self-weight, determine the maximum deflection of the structure using the large deformation analysis.
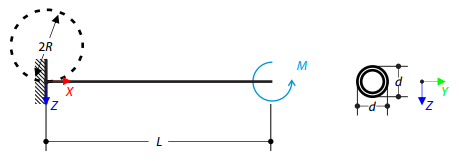
Déterminez le moment fléchissant qui, agissant à l'extrémité libre du porte-à-faux, fléchit la barre en forme circulaire. Neglecting the beam's self-weight, assuming the large deformation analysis, and loading the cantilever with the moment, determine its maximum deflections.
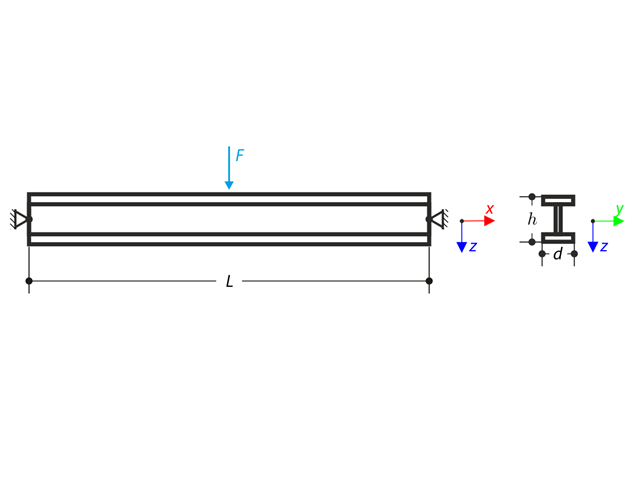
Une poutre articulée aux deux extrémités est chargée avec une force concentrée au centre. Neglecting its self-weight and shear stiffness, determine the beam's maximum deflection, normal force, and moment at the mid-span, assuming the second- and third-order analysis.
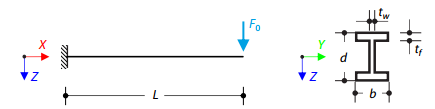
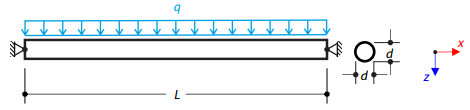
Une poutre en acier de section carrée est chargée avec un effort normal et une charge répartie. The image shows the calculation of the maximum bending deflection and critical load factor according to the second-order analysis.
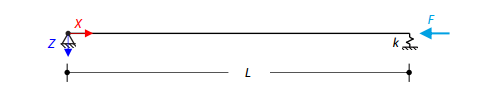
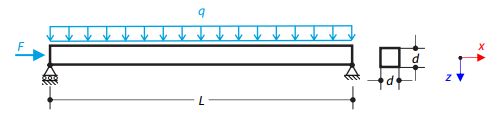
Une poutre en acier chargée axialement avec une section carrée est fixée à une extrémité et supportée par un ressort à l'autre. Two cases with different spring stiffnesses are considered. The verification example solves the calculation of the load factors of the beam in the image using the linear stability analysis.