3016 Resultados
Ver resultados:
Ordenar por:

Exportar de RSECTION a SHAPE-THIN
¿Es posible exportar datos de secciones de RSECTION a SHAPE-THIN?

Implementación de datos experimentales en RWIND
¿Cómo podemos introducir datos experimentales en RWIND?

Mensaje de error de cálculo en la nube
Me gustaría comenzar mi cálculo en la nube. Sin embargo, aparece el mensaje de error "Error en la carga del archivo con error en el protocolo de enlace SSL". visualizada. ¿Cuál es el problema?

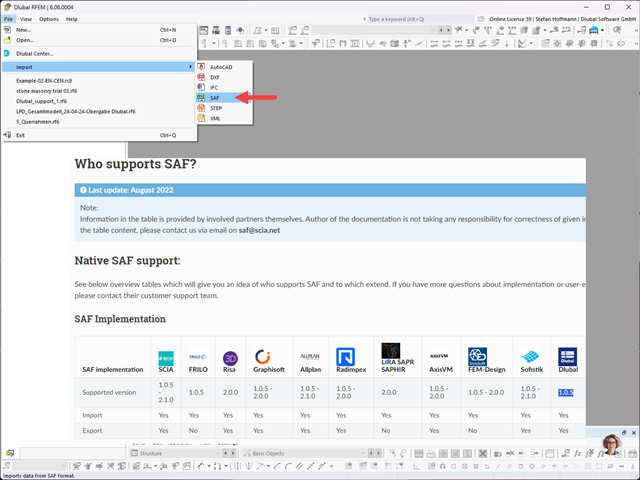
Uso de RSECTION para exportar de Revit a RFEM 6
¿Cómo puedo usar una sección de RSECTION al exportar un modelo de Revit a RFEM 6?

Factor de refinamiento de la malla de elementos finitos para reducir el tiempo de cálculo
¿Cómo puedo reducir el tiempo de cálculo para barras con un modelo de material no lineal en RFEM 6 y RSTAB 9?
- 005529
- Servicio web y API | Fundamentos básicos | Suscripción | 3 meses
- Análisis y dimensionamiento de estructuras
Significado de location_flags de la clase members_internal_forces (API de Servicio web)
¿Cuál es el significado de location_flags en la clase members_internal_forces de la API de Servicio web?

Análisis estático de tensiones diferenciales - cálculo tensión-deformación
¿Por qué las tensiones del análisis estático son diferentes del complemento de análisis tensión-deformación?
Solicitudes web (API) de la Herramienta de zonas geográficas: Especificar idioma
¿Cómo puedo cambiar el idioma para las consultas web (API) de la Herramienta de zonas geográficas?

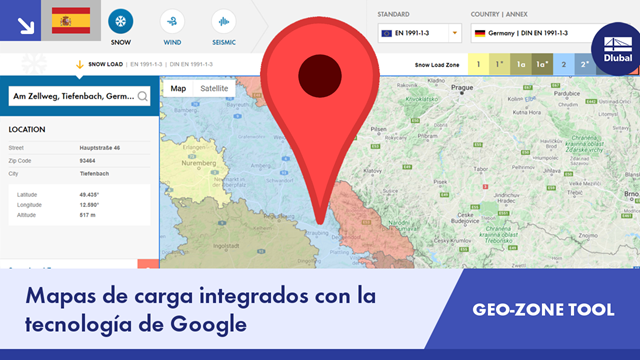
Solicitudes web (API) de la herramienta de zonas geográficas: Configuración de cargas y normas
¿Cómo puedo configurar la carga y las normas para solicitudes web (API) de la herramienta de zonas geográficas?
Archivos de SHAPE-THIN 9 en RFEM 6 y RSTAB 9
¿Es posible usar archivos SHAPE-THIN 9 en RFEM 6 y RSTAB 9?

Análisis de estabilidad de componentes estructurales con sección asimétrica
¿Es posible utilizar el método general según EN 1993-1-1, 6.3.4 para calcular componentes estructurales con una sección asimétrica en el complemento Cálculo de acero para RFEM 6 o RSTAB 9?

Estructura por debajo del nivel del suelo
¿Por qué no funciona la integración o apoyo de mi edificio en el terreno bajo el nivel del suelo?

Ajuste de los factores NDS y CSA O86 para su consideración en el complemento Cálculo de madera
¿Cómo se pueden ajustar manualmente los factores NDS y CSA O86 para su consideración en el complemento Cálculo de madera?
Hormigón pretensado en RFEM 6
¿Es posible diseñar una losa de hormigón pretensado en RFEM 6?
Instalación de complemento
He comprado un nuevo complemento. ¿Dónde puedo encontrar el archivo de instalación para esto?
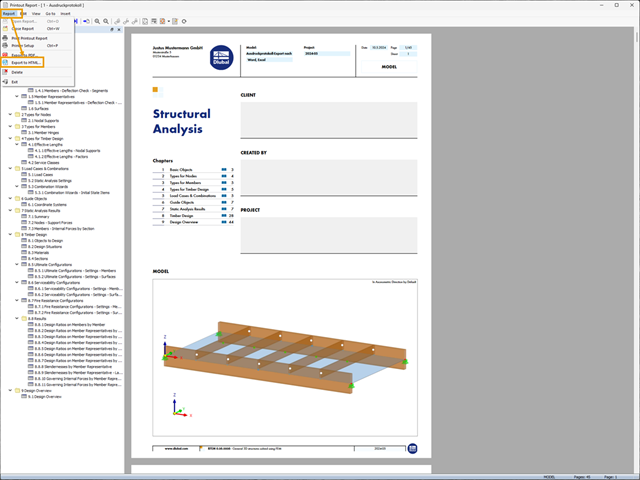
Exportación del informe a Word y Excel
¿Cómo puedo exportar un informe a Microsoft Word o Excel en RFEM 6 / RSTAB 9?
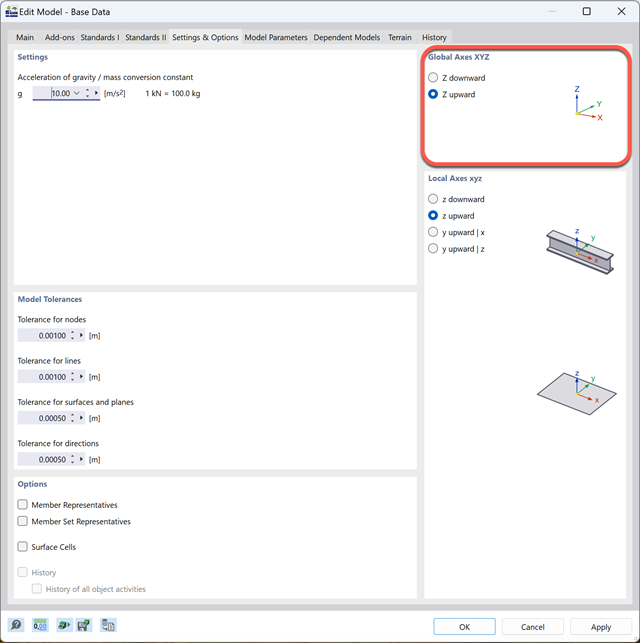
Invertir el eje Z global en RFEM 6
¿Dónde puedo invertir posteriormente el sistema de ejes global en RFEM 6 (dirección del eje Z global)?
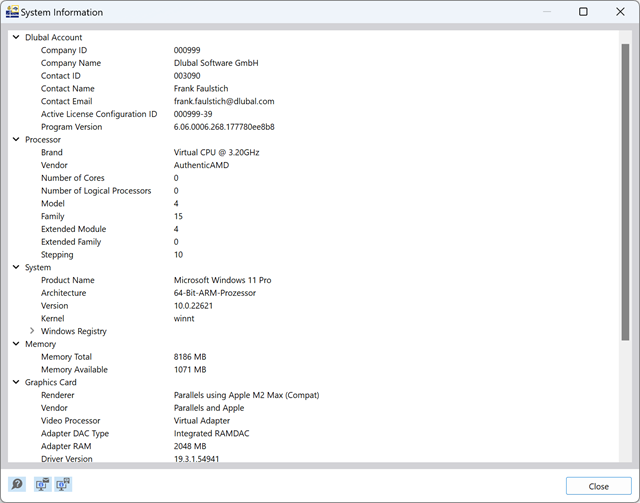
Número de versión de RFEM 6 / RSTAB 9
¿Dónde puedo encontrar el número de versión de RFEM 6 / RSTAB 9?
Cálculo de hormigón armado de sólidos (cuerpos con volumen)
¿Es posible utilizar los complementos para RFEM 6 para calcular sólidos de hormigón?

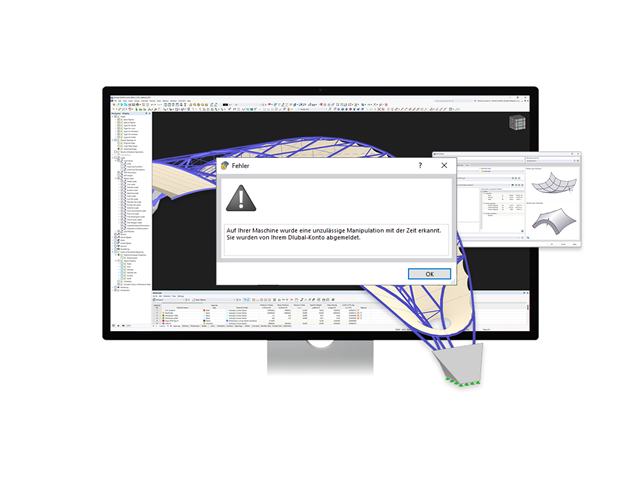
Manipulación no permitida con el tiempo
En RFEM 6 o RSTAB 9, recibo un mensaje que dice que se ha detectado una manipulación no permitida con el tiempo. ¿Qué puedo hacer?
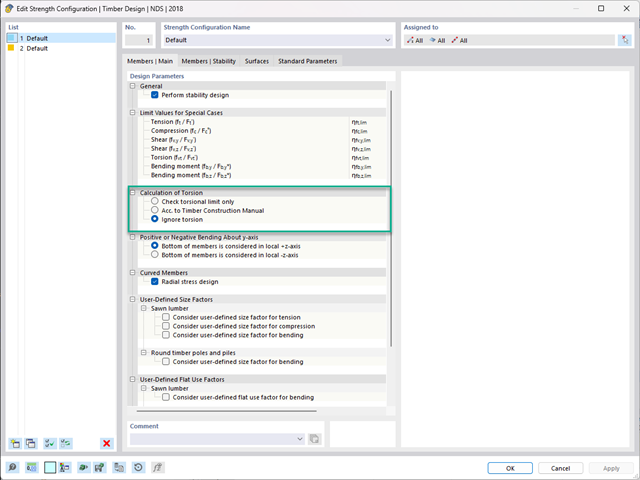
Configuración de la resistencia de NDS - Cálculo de la configuración de la torsión
¿Qué cálculo se realiza para las opciones de "Cálculo de torsión" de la configuración de resistencia de NDS?
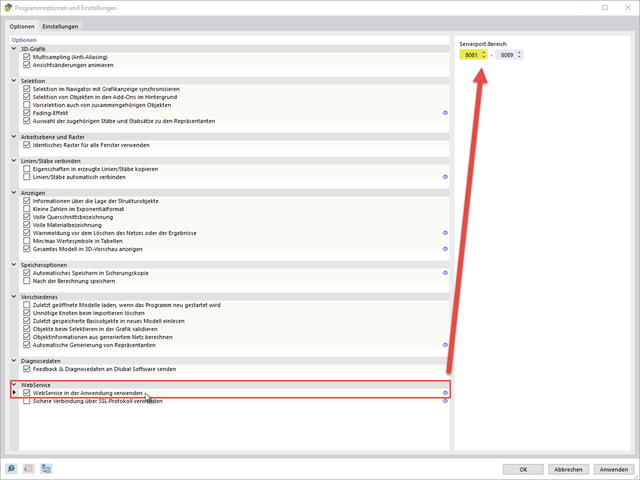
Sigo recibiendo un mensaje de error, aun estando activada la configuración del Servicio web en RFEM 6.
Sigo recibiendo un mensaje de error, aun estando activada la configuración del Servicio web en RFEM 6.
SHAPE-THIN 9 en combinación con RSTAB 8
¿Puedo usar SHAPE-THIN 9 en combinación con RSTAB 8?