The structural analysis software RFEM 6 is the basis of a modular software system. The main program RFEM 6 is used to define structures, materials, and loads of planar and spatial structural systems consisting of plates, walls, shells, and members. The program also allows you to create combined structures as well as to model solid and contact elements.
RSTAB 9 is a powerful analysis and design software for 3D beam, frame, or truss structure calculations, reflecting the current state of the art and helping structural engineers meet requirements in modern civil engineering.
Do you often spend too long calculating cross-sections? Dlubal Software and the RSECTION stand-alone program facilitate your work by determining section properties of various cross-sections and performing a subsequent stress analysis.
Do you always know where the wind is blowing from? From the direction of innovation, of course! With RWIND 2, you have a program at your side that uses a digital wind tunnel for the numerical simulation of wind flows. The program simulates these flows around any building geometry and determines the wind loads on the surfaces.
Are you looking for an overview of snow load zones, wind zones, and seismic zones? Then you are in the right place. Use the Geo-Zone Tool to determine quickly and efficiently snow loads, wind speeds, and seismic data according to ASCE 7‑16 and other international standards.
Would you like to try out the capabilities of the Dlubal Software programs? You have the opportunity to do so! The free 90-day full version allows you to thoroughly test all our programs.
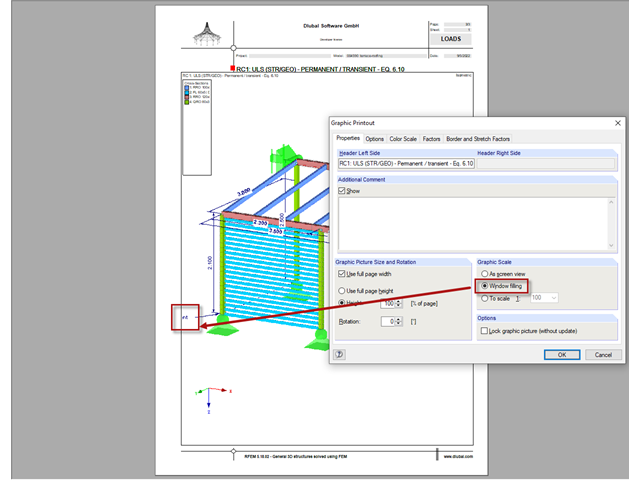
When printing a graphic with the "window filling" setting, all objects of the window content that can be displayed completely are printed in the printout report. However, variable objects, such as the text of dimensions or comments, do not limit this graphic because the text is scaled according to the zoom setting.
It is usually very easy to check whether all objects meet this requirement: To do this, activate the display of light positions in Project Navigator - Display. All objects that are now within the dashed box are usually also shown in the printout report.
As an alternative, you can also use the "As screen view" setting for the graphic printing in such a case.
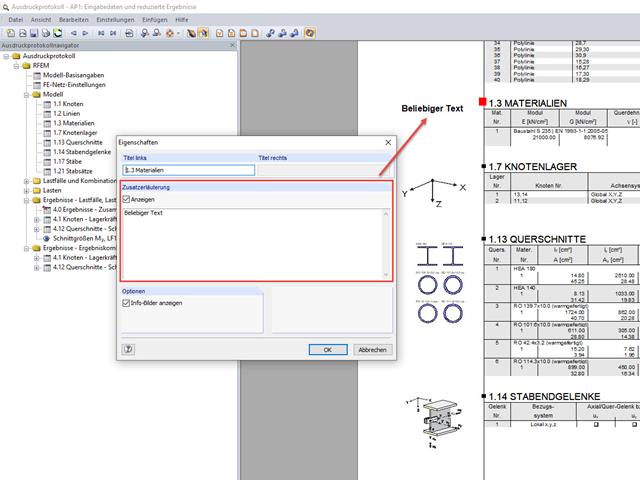
In the "Properties" dialog box, you can change the title of a chapter and enter an additional comment, which will appear on the left page margin of the printout report. It is possible to show or hide this additional text.
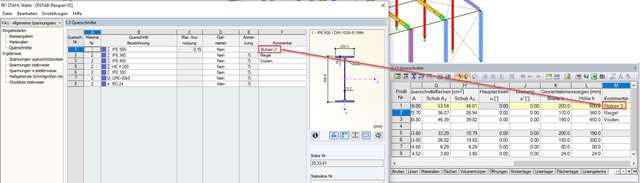
You can also insert additional comments to the graphics in the printout report.
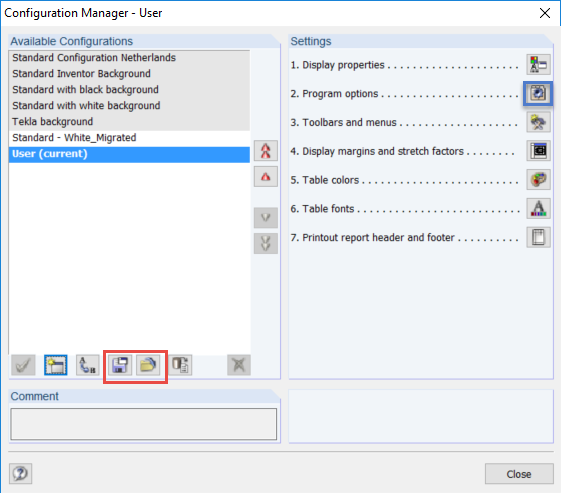
If you prepare comments, they are saved in the current configuration. You can save this configuration and then import it to another computer.