The structural analysis software RFEM 6 is the basis of a modular software system. The main program RFEM 6 is used to define structures, materials, and loads of planar and spatial structural systems consisting of plates, walls, shells, and members. The program also allows you to create combined structures as well as to model solid and contact elements.
RSTAB 9 is a powerful analysis and design software for 3D beam, frame, or truss structure calculations, reflecting the current state of the art and helping structural engineers meet requirements in modern civil engineering.
Do you often spend too long calculating cross-sections? Dlubal Software and the RSECTION stand-alone program facilitate your work by determining section properties of various cross-sections and performing a subsequent stress analysis.
Do you always know where the wind is blowing from? From the direction of innovation, of course! With RWIND 2, you have a program at your side that uses a digital wind tunnel for the numerical simulation of wind flows. The program simulates these flows around any building geometry and determines the wind loads on the surfaces.
Are you looking for an overview of snow load zones, wind zones, and seismic zones? Then you are in the right place. Use the Geo-Zone Tool to determine quickly and efficiently snow loads, wind speeds, and seismic data according to ASCE 7‑16 and other international standards.
Would you like to try out the capabilities of the Dlubal Software programs? You have the opportunity to do so! The free 90-day full version allows you to thoroughly test all our programs.
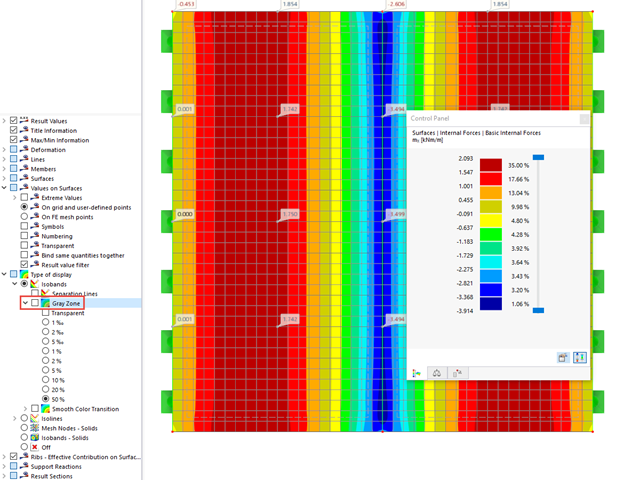
If there are only individual areas that are governing for the design in a model, the evaluation based on isobands may quickly become confusing.
When displaying the results, RFEM 6 provides the option of activating gray areas. This means that the areas with low loads are hidden and the color scale spectrum only shows the relevant areas. Image 01 and Image 02 show the difference between the deactivated and the activated gray areas.
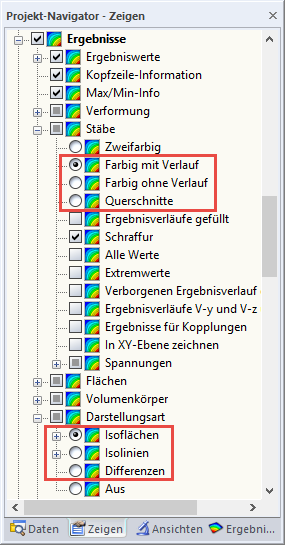
For this, select "Type of Display" → "Isobands" → "Gray Zone" in the lower part of the result navigator and activate it. You can select a value between 0.1% and 50% to which the gray area should extend. This percentage value indicates the limits of the gray area, based on the absolute minimum and maximum of the active result variable.
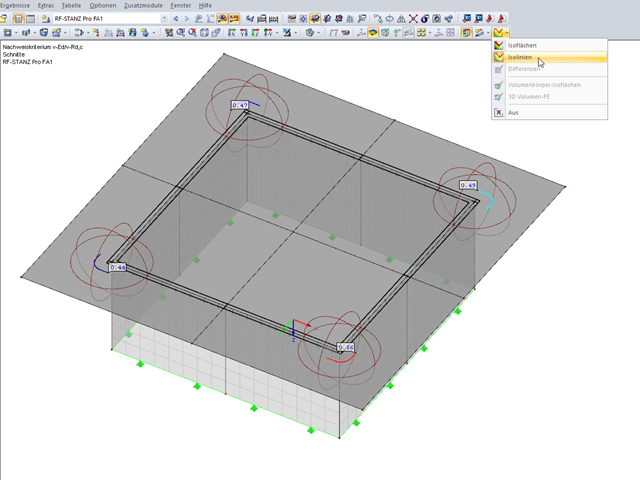
It is possible to use the "isolines" instead of displaying the results with "isobands" in the graphic.
First, switch to the "Isolines" display.
Then, you can additionally set in the Display navigator that the "Result Values Defined Automatically" should be displayed for the isolines.
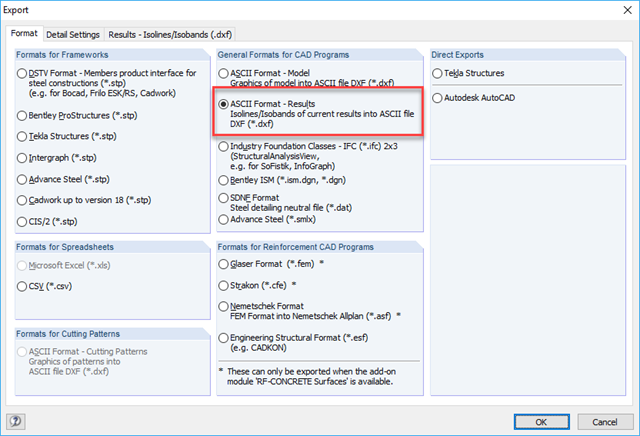
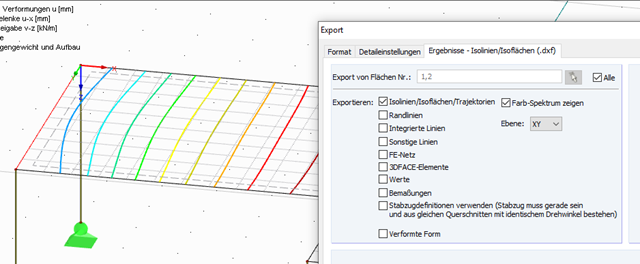
For a successful export/import of a DXF file including isolines/isobands, the following requirements must be met:
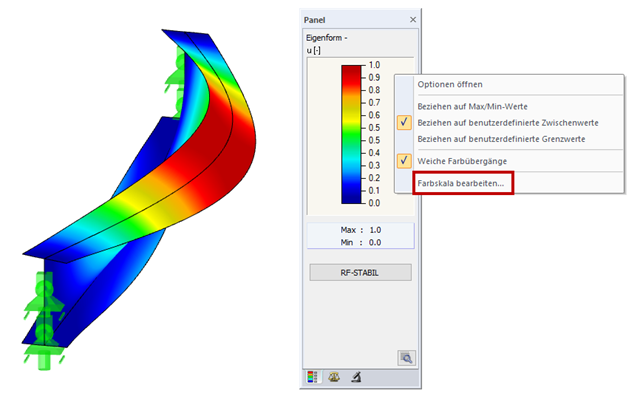
To display the color scale, create the following settings: