Answer:
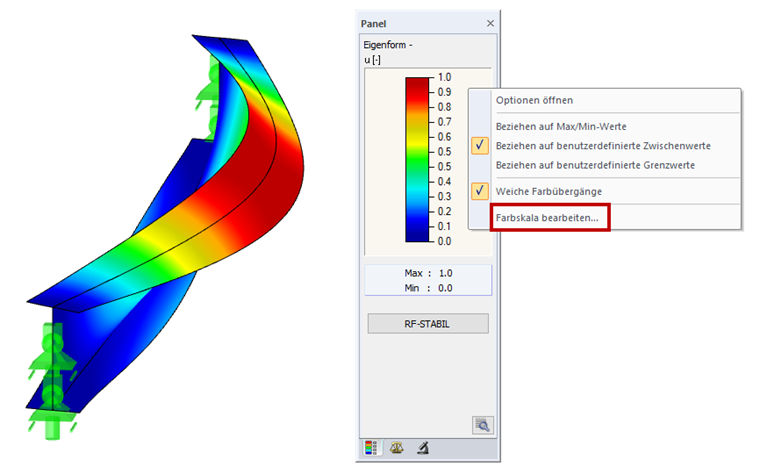
To display the isobands of the results in a single color, you have to edit the color scale. To do this, simply double-click the color scale or edit the color scale by clicking the right mouse button (see Image 01). The slider can then be pushed down so far that only one color remains.
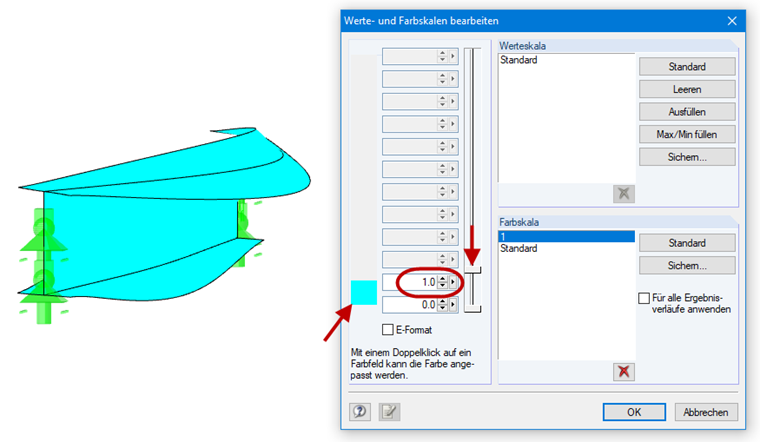
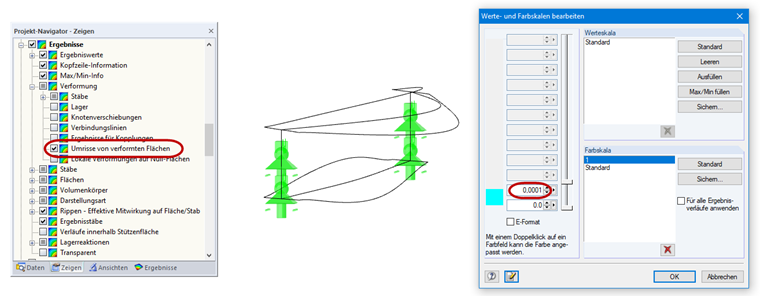
You can change this by double-clicking the color. Then, the maximum value can be transferred manually to the forelasttext box (see Image 02). If you want a colorless display, define a very small number for the forelast value. We also recommend activating the "Outlines of Deformed Surfaces" option (see Image 03).