The "Scalar Fields" options available in the "View" navigator allow you to display the results values related to every point of the model in different ways.
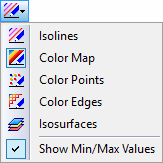
As an alternative, select the display option from the list button in the toolbar.
Please note that the type of display must match the type of result: For example, isosurfaces representing a 3D finite volume mesh results cannot be applied to a 2D surface pressure results.
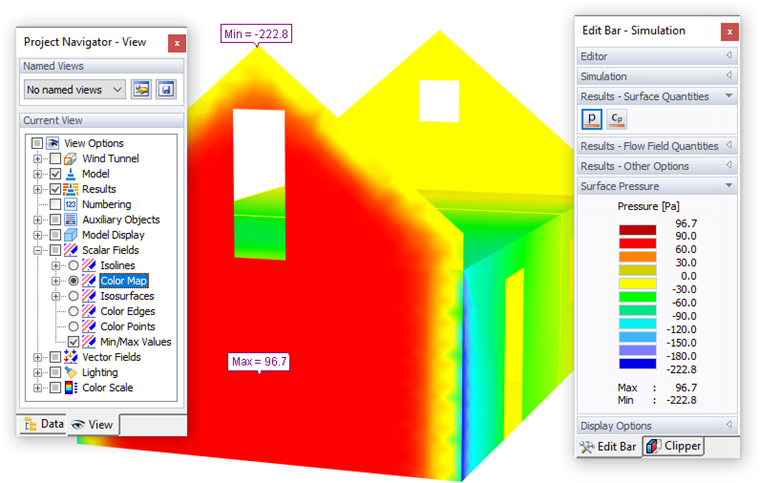
The "Color Map" display option is set by default. It fits all types of results and model displays, because it is adapted automatically. In the panel, the eleven principal colors with the corresponding values are represented. You can adjust both colors and values, if necessary (see Chapter Color Map).
Isolines represent the lines of points with equal results. By default, there are eleven colors allocated to the lines featuring values at equidistant intervals. Isolines can be useful for printing graphics to a monochrome printer.
Isosurfaces are the surfaces featuring identical values of the 3D finite volume mesh output. This option can be used to display a pressure field and the velocity field results.
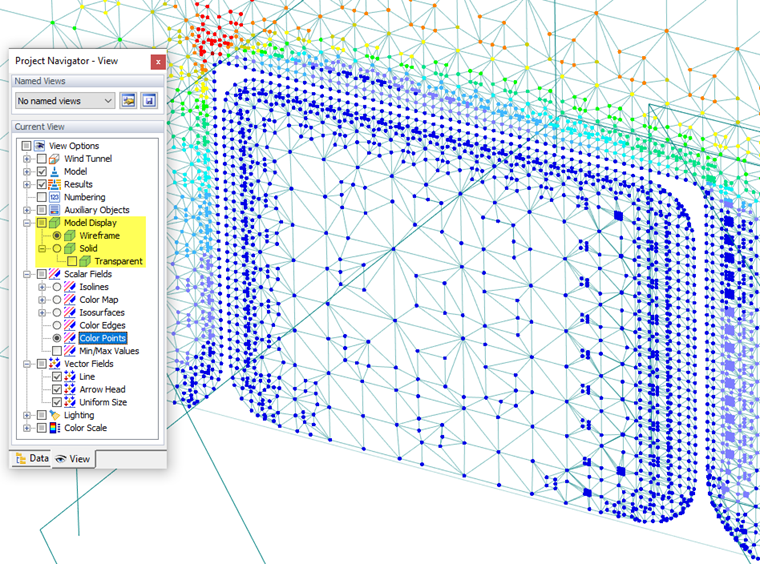
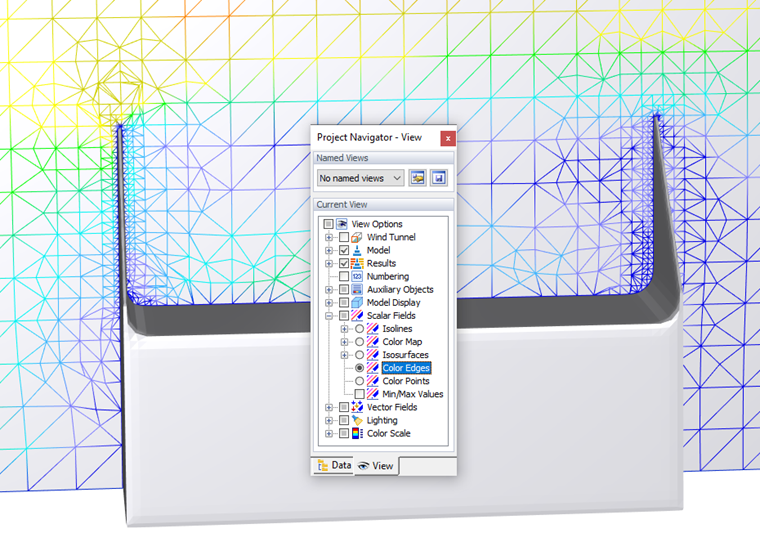
The "Color Edges" and "Color Points" options illustrate the results of the 3D finite volume mesh. Thus, they are useful for displaying the pressure field and velocity field results by means of colored mesh lines or colored mesh nodes, respectively.
If activating the "Min/Max Values" option, the extreme values of the selected result type are shown. You can display the ordinary values by moving the pointer across the surface or within the slicer plane.
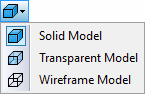
Depending on the selected type of results, the "Solid/Transparent Model" view or the "Wireframe Model" view is advantageous when evaluating the results. You can also select the model display option from the list button in the toolbar.