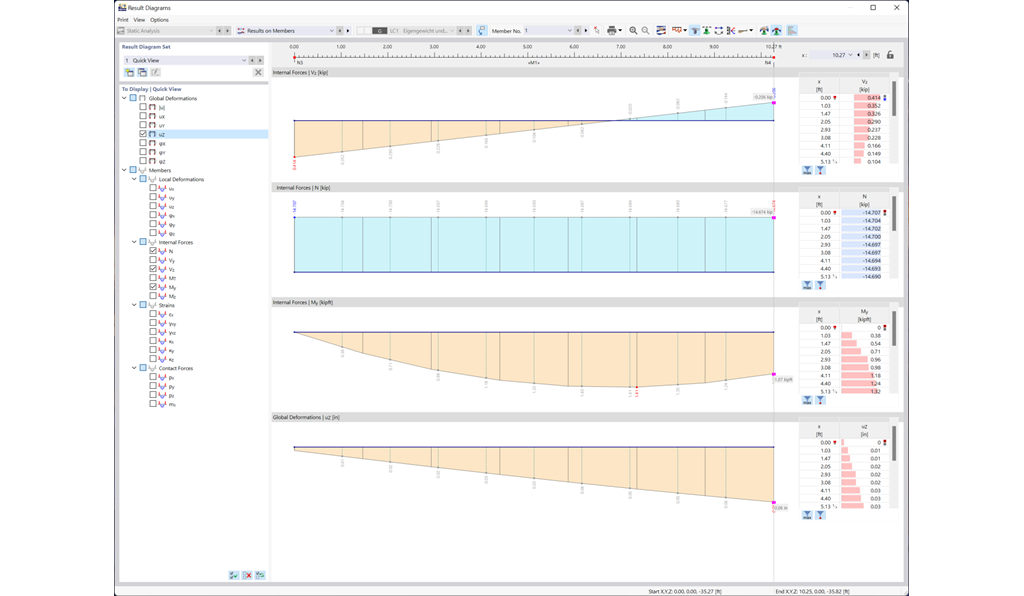
Customize the display of your data to your individual preferences. The result diagrams of members, surfaces (RFEM), and supports are freely configurable. You can define smooth ranges with average values or, if necessary, display and hide the result distributions. This ensures targeted evaluation of your results. Furthermore, you can easily add all diagrams to the printout report.
Sign in to your account
Sign up for the Dlubal Extranet to get most of the software and have exclusive access to your personal data.
By signing-in you agree to Dlubal Conditions of Use & Sale. Please see our Privacy Notice, our Cookies Notice.
Sign in to your account
Sign up for the Dlubal Extranet to get most of the software and have exclusive access to your personal data.
Sign in to your account
Sign up for the Dlubal Extranet to get most of the software and have exclusive access to your personal data.