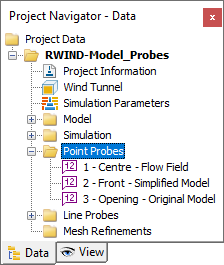
RWIND provides an option to define the locations for results at specific points on the model or within the wind tunnel around it. These control points are called "Probes." They can be used to evaluate and manage the result values for both surface and flow field quantities. These numerical results defined for the RWIND 2 model are also used to document results in the printout report of RFEM 6 or RSTAB 9 (see Chapter Printout Report). You can define probes for points and lines (see Chapter Graph Along Line). All sets of probes are shown in the navigator tree.
To insert point probes, use the "Insert" menu or the "Insert Point Probes" button
![]() , which is available in the Current Point Probe section of the panel.
, which is available in the Current Point Probe section of the panel.
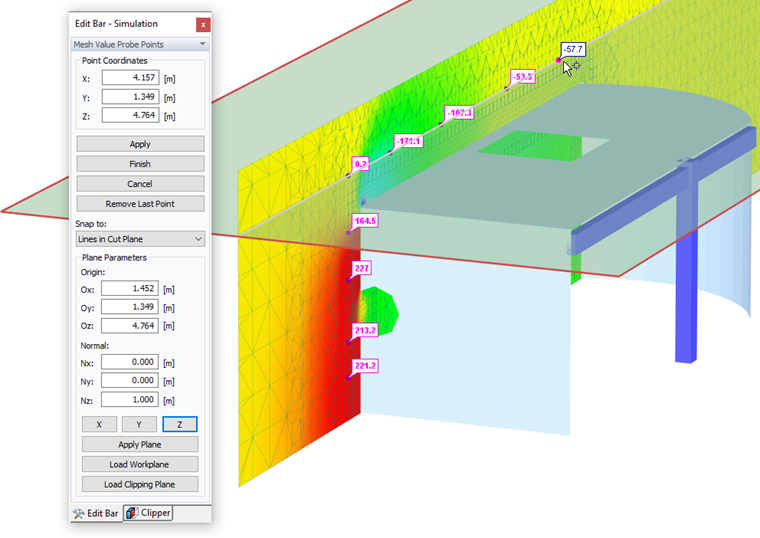
When the function has been activated, the relevant points can be selected by mouse clicks. The coordinates of the points are displayed in the panel, which has a specific layout for this purpose. You can also modify the object snap there, if necessary. When you have selected all the points, click
![]() .
.
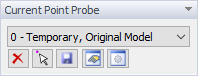
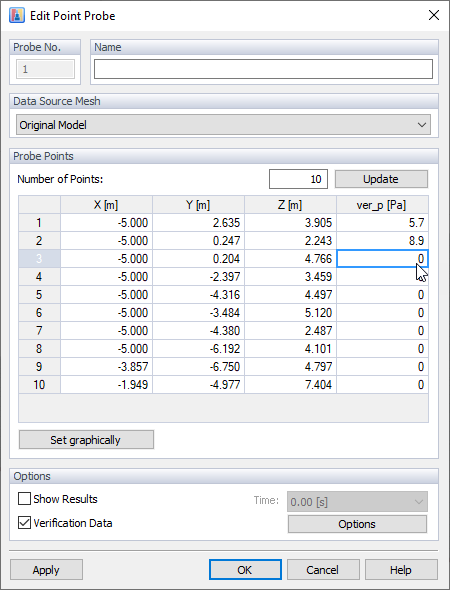
The current sample of probe points is denominated 0 - Temporary. To save it permanently, use the "Save Probe Copy" button
![]() below the list of point probes. A new dialog box appears where you can define the "Name'"of the probe and check the coordinates of each point.
below the list of point probes. A new dialog box appears where you can define the "Name'"of the probe and check the coordinates of each point.
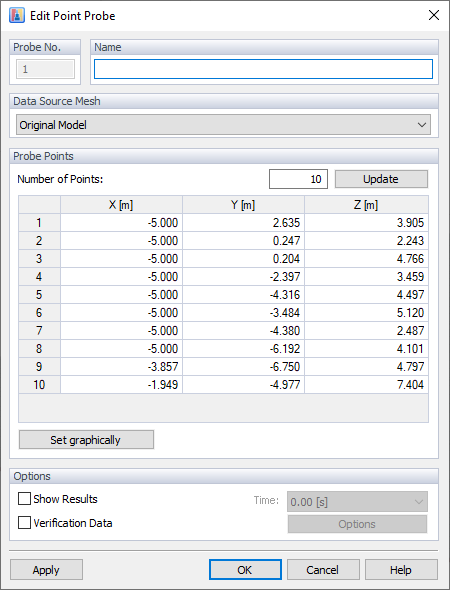
The options of the "Data Source Mesh" section control to which type of mesh the probes refer (see Chapter Computational Mesh and Model Simplification).
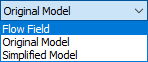
The probes are specific to three categories of the data source meshes:
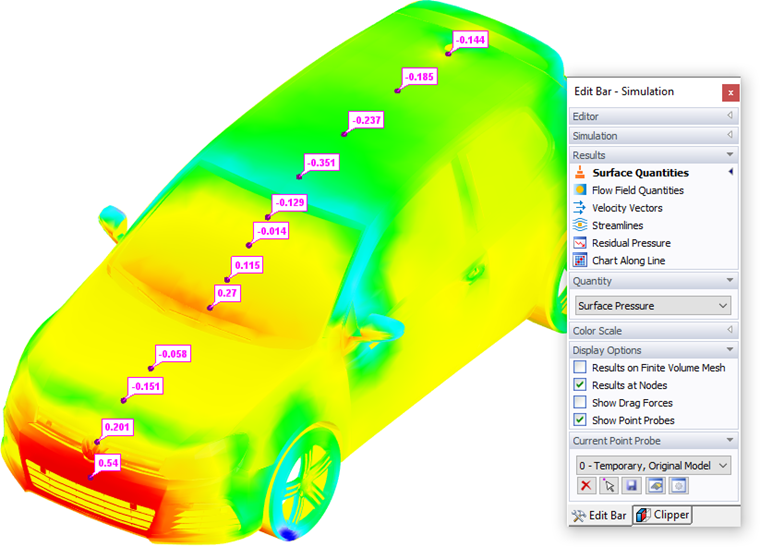
- Original Model – Display of surface quantities on a surface mesh (that is, the Results of "Finite Volume Mesh" option is disabled)
- Simplified Model – Display of surface quantities on a finite volume mesh
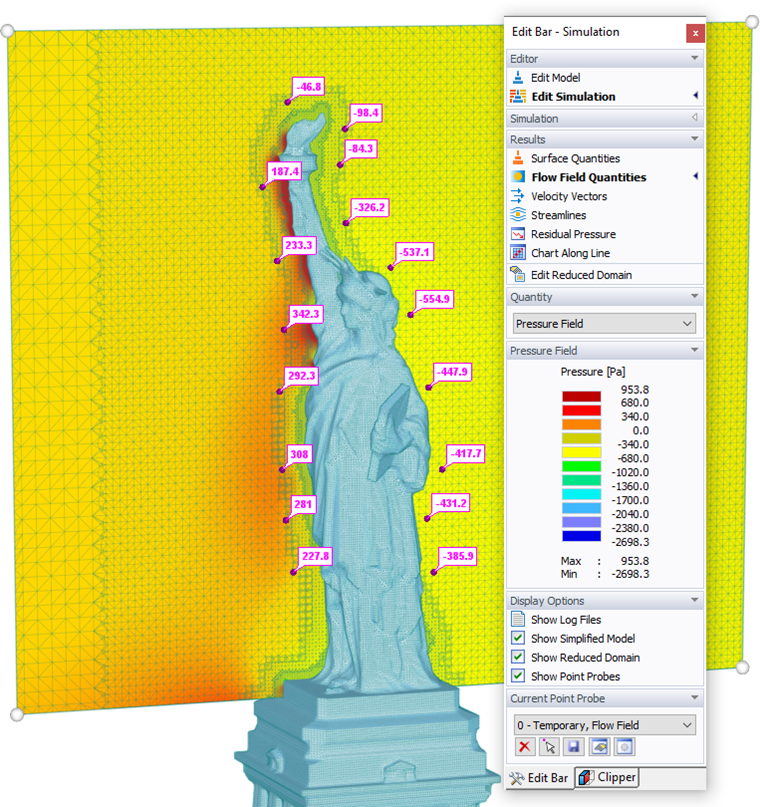
- Flow Field – Display of flow field quantities on a finite volume mesh
For example, the flow field results (pressure field, turbulence, and so on) require different locations of probes than the surface results (surface pressure, Cp coefficient).
Verification Data Options
If you check "Verification Data", then it is possible to manually enter verification values (verification pressure) in table.
Verification data settings can be found in "Options", here you can select the interpolation method and set the data range constraints.
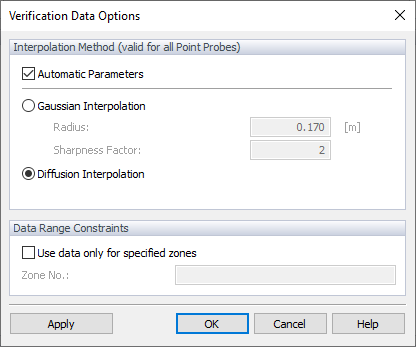
There are two possible interpolation methods. First Gausian interpolation method is an interpolation kernel that simply returns the weights for all points found in the sphere defined by radius R. The weights are computed as:
| r | Distance from the point to be interpolated to a neighboring point within R |
| s | Sharpness that affects the rate of the Gaussian's fall |
| R | Radius of the sphere where the interpolation points are found |
The complete documentation is available here.
The second interpolation method is diffusion. It is Iterative process based on weighted diffusion, for every vertices vi of the volume mesh we associate a set of weights {⋯, βij,⋯} corresponding to each direct neighbor:
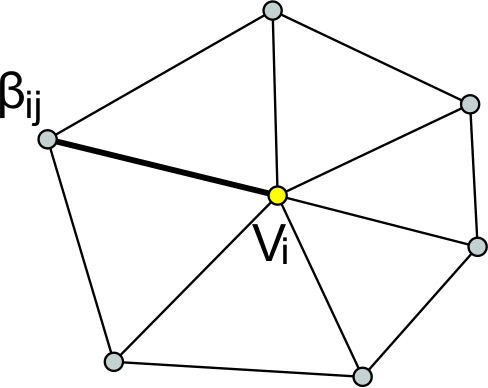
, weighted average of the neighbouring values is taken:
The iterative process of weighted diffusion method can be analogized by heat transfer, imagine the individual points as heat sources, the heat spreads from the source through the mesh by diffusion, individual points (heat sources) influence each other's temperature field depending on the magnitude of their temperature (value at the point).
Furthermore, in the section "Data Range Constraints", there is a verification data extrapolation range, the data is displayed only in the predefined zones.
The verification data are defined at the probe points but for the graphical display of verification data isobands (scalar fields), it is necessary to calculate the continuous distribution of values over the entire mesh. This can only be done on the computational mesh, since the mesh of the original model does not have to be correct/continuous. After calculating the distribution of verification data on this mesh, all verification data values are transferred to the original model (similar to extrapolated pressure).
Therefore, no matter where verification data is defined, it is always transferred to both surface meshes (original + computational) regardless of whether the point probe is defined on the original or simplified model.
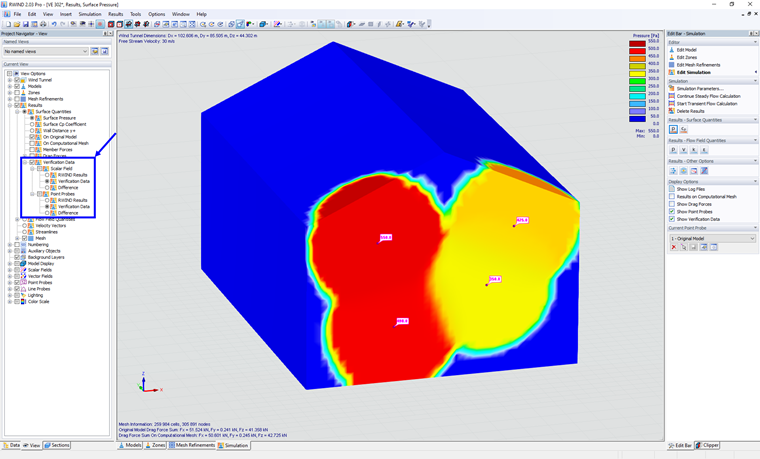
Verification data can be displayed in "Project Navigator - View", here you can display the verification data in scalar field (on model mesh) and in point probes (values). Here you can switch between RWIND results, verification data or the differences (difference between verification data and RWIND results). More details about the results in the chapter Verification Data.
The buttons in the Current Point Probe section of the panel have the following
functions:
|
|
The "Clear Probe Points" button deletes all point probes of the current probe set in the list. |
|
|
The "Insert Probe Points" button adds new points. |
|
|
The "Save Probe Copy" button saves the current set of points. |
|
|
The "Edit Probe" button checks and modifies the current probe. |
|
|
The "Options and Commands" button controls whether all probes are shown in graphics or only the current one. |