The structural analysis software RFEM 6 is the basis of a modular software system. The main program RFEM 6 is used to define structures, materials, and loads of planar and spatial structural systems consisting of plates, walls, shells, and members. The program also allows you to create combined structures as well as to model solid and contact elements.
RSTAB 9 is a powerful analysis and design software for 3D beam, frame, or truss structure calculations, reflecting the current state of the art and helping structural engineers meet requirements in modern civil engineering.
Do you often spend too long calculating cross-sections? Dlubal Software and the RSECTION stand-alone program facilitate your work by determining section properties of various cross-sections and performing a subsequent stress analysis.
Do you always know where the wind is blowing from? From the direction of innovation, of course! With RWIND 2, you have a program at your side that uses a digital wind tunnel for the numerical simulation of wind flows. The program simulates these flows around any building geometry and determines the wind loads on the surfaces.
Are you looking for an overview of snow load zones, wind zones, and seismic zones? Then you are in the right place. Use the Geo-Zone Tool to determine quickly and efficiently snow loads, wind speeds, and seismic data according to ASCE 7‑16 and other international standards.
Would you like to try out the capabilities of the Dlubal Software programs? You have the opportunity to do so! The free 90-day full version allows you to thoroughly test all our programs.
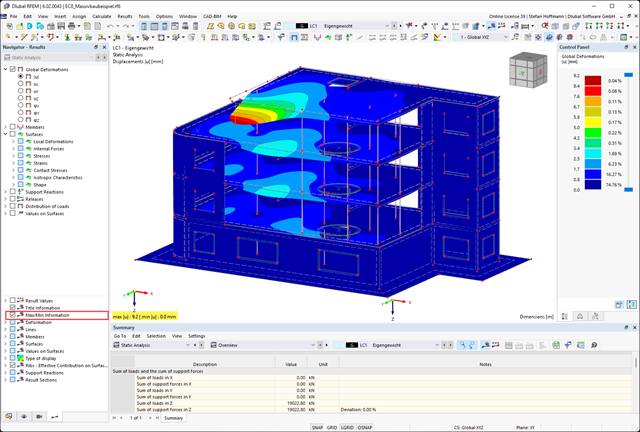
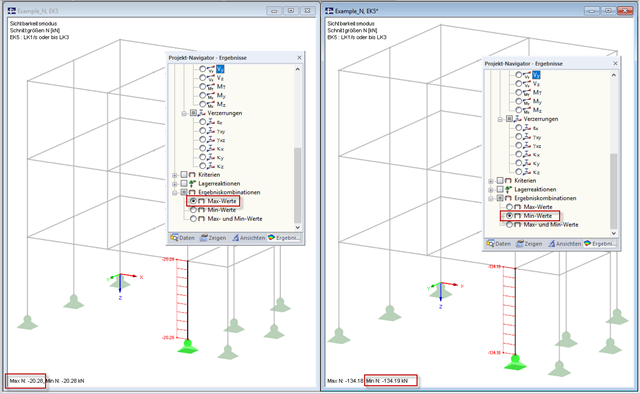
If the max/min information is no longer displayed, please check whether you have activated this in the Navigator - Results.
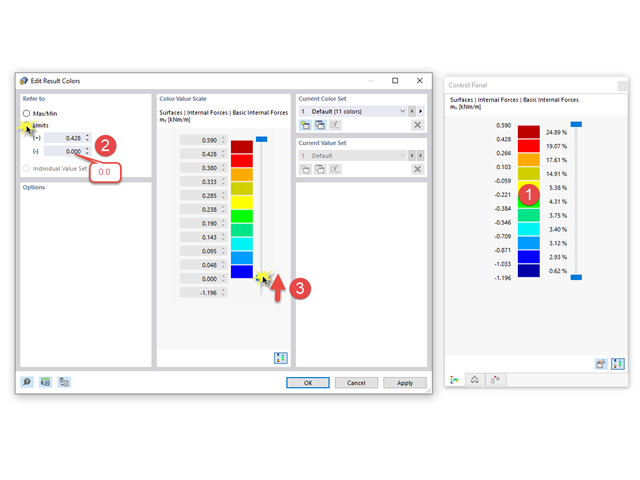
To set the value scale to a defined range (for example, positive values only), double-click the color scale of the control panel.
A dialog box appears where you can change the reference from "Max/Min" to "Limits" and define the limit values manually here (for example, Min = 0.0).
To completely hide the excluded value ranges in the graphic, move the slider to the right of the value scale at the minimum by one level (see Image 01).
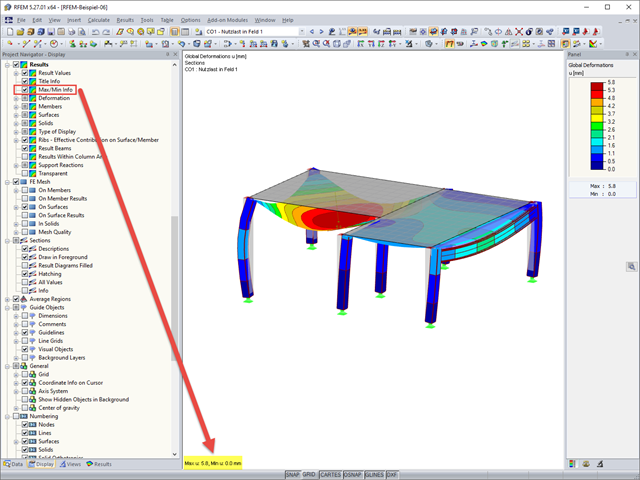
If the MAX/MIN information is no longer displayed, please check whether you have activated this in the Display navigator.
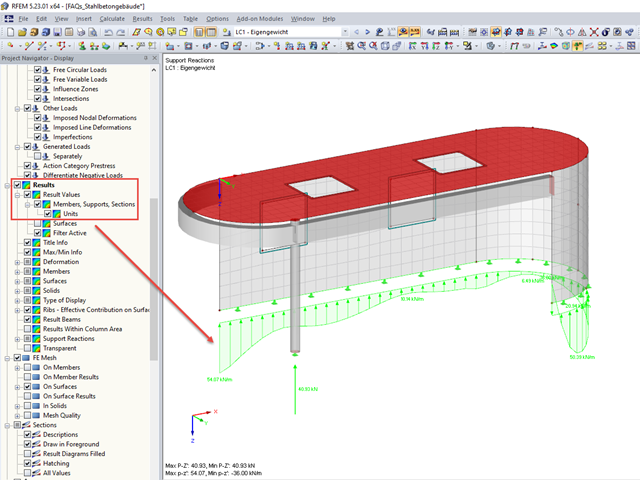
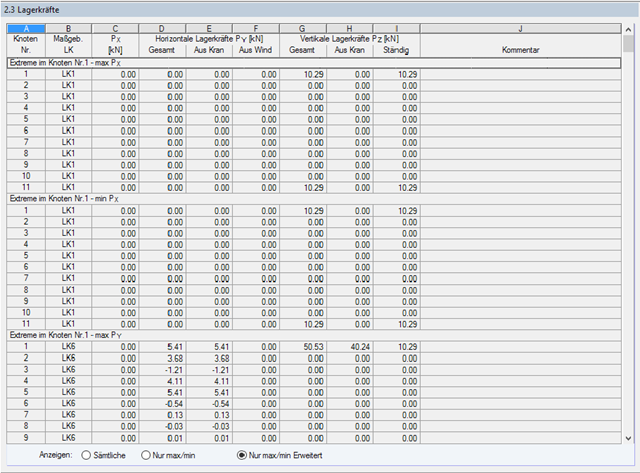
The units of the node and line supports can be seen in the max/min info. For the support forces, for example, the unit kN/m is used, and for the support moments, kNm/m.
The note about this is not preset in the graphic because the results of internal forces can also be displayed in the graphic at the same time. To activate the output of units, select "Result Values" under "Results" in "Project Navigator - Display".
The value refers to a distance of 1 m.
A partial value is specified in each FE Mesh Node. A snapshot (so to speak) of the line support is displayed.
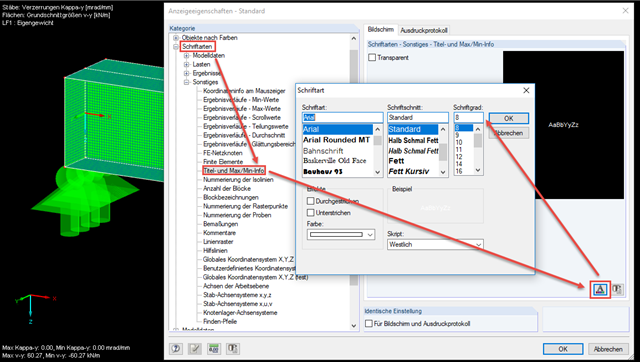
In order to print the image without loads and without reference to a load case, it is necessary to hide all results and loads.
Only when there is no text at all in the title and max/min info will the image be printed into the printout report without any reference.
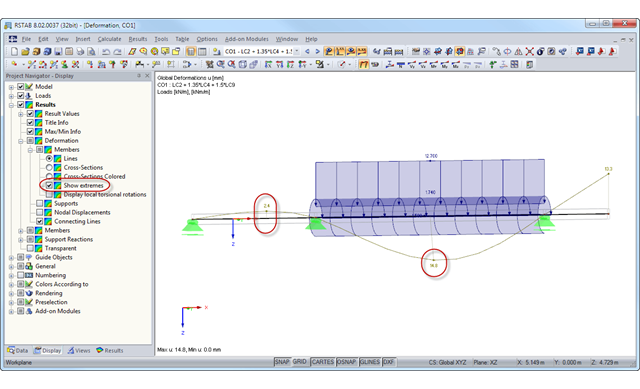
You can display the maximum deformation of each member by activating the "Show Max/Min Values" option in the "Display" navigator under "Results" → "Deformation" → "Members".
Note
If you have made several changes and want to use them again and again, you can define the entire "Display" navigator setting as the default setting. To do this, right-click in the free Navigator area and select the "Save Settings as Default" option.
The following points should be considered in order to use the determined internal forces for the design:The model should represent the real structure as precisely as possible. Therefore, it is necessary to correctly define the materials, surface thicknesses, cross-section dimensions, hinge definitions, support conditions, and so on.Loads must be defined and applied in compliance with the standard. RFEM can import the combinations automatically.In the case of internal forces from result combinations, it is necessary to pay attention to the evaluation of the correct max/min values. The maximum compression force in a column corresponds to the minimum axial force (min N).
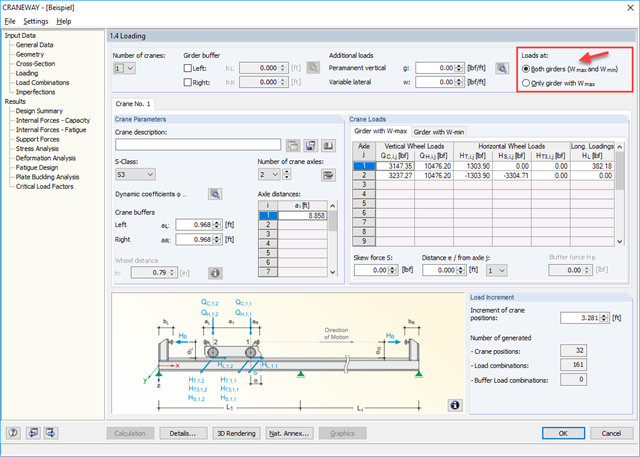
To get the result of the MAX/MIN support reactions with the associated values on different crane runway girders, the design of both girders in CRANEWAY is required. To do this, select the option "Both girders (Wmax and Wmin)" in Window 1.4 Loading (see Image 01).
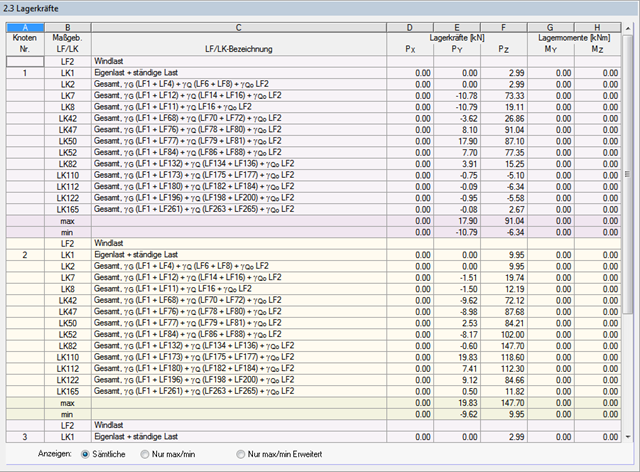
Then, select the Only max/min option in result window 2.3 Support Forces at Bottom Edge. The results are then displayed for both girders (girders with Wmax and girders with Wmin) sorted by the individual load components and supports. There are two lines with results for each support and load component.
Image 02 shows the following values for Support 1:
The displayed support forces are the characteristic values, including the reduced dynamic factors, and can thus be used directly for a further calculation.
There are three ways to sort the display in result window 2.3.