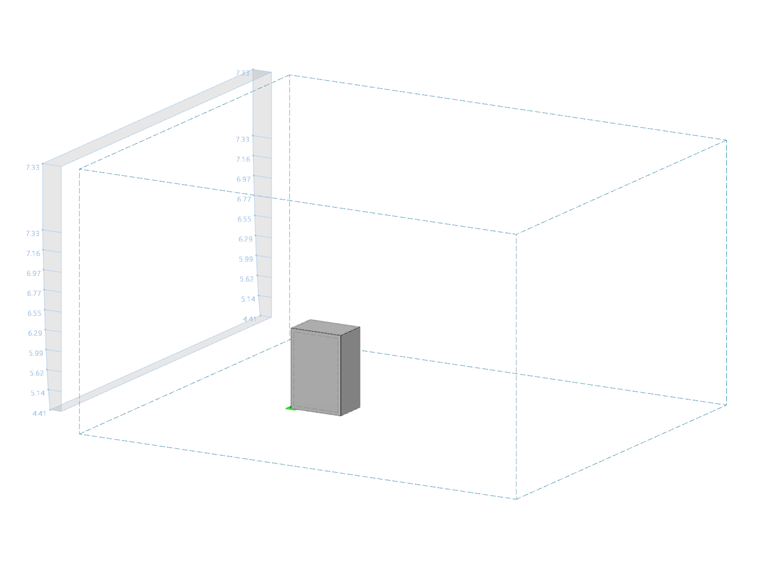
The following article deals with the comparison of a reference study conducted by the Graz University of Technology in Austria [1] by means of an imitated simulation performed in RWIND.
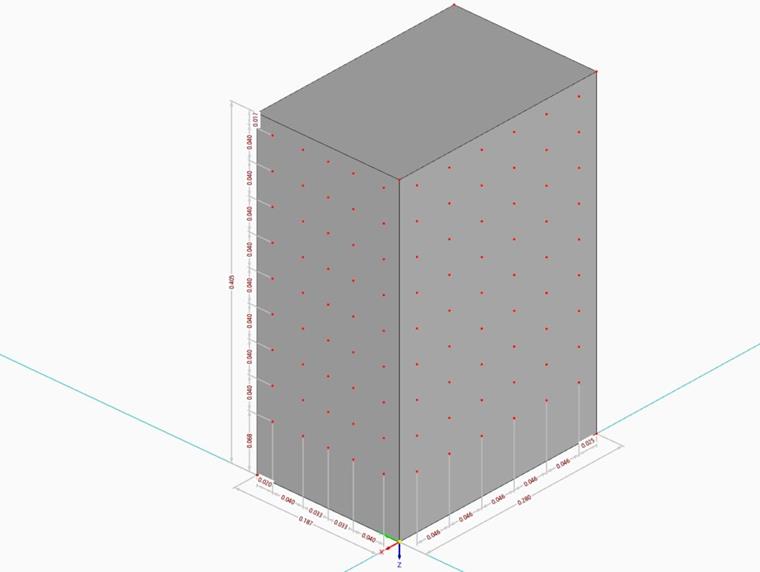
Within the scope of the study, a cuboid was analyzed in a wind tunnel test with regard to pressure distribution. Then, the test was remodeled in ABAQUS and ANSYS, and results were compared.
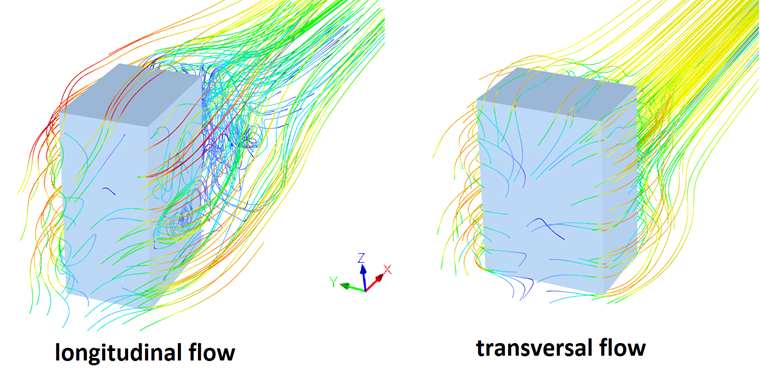
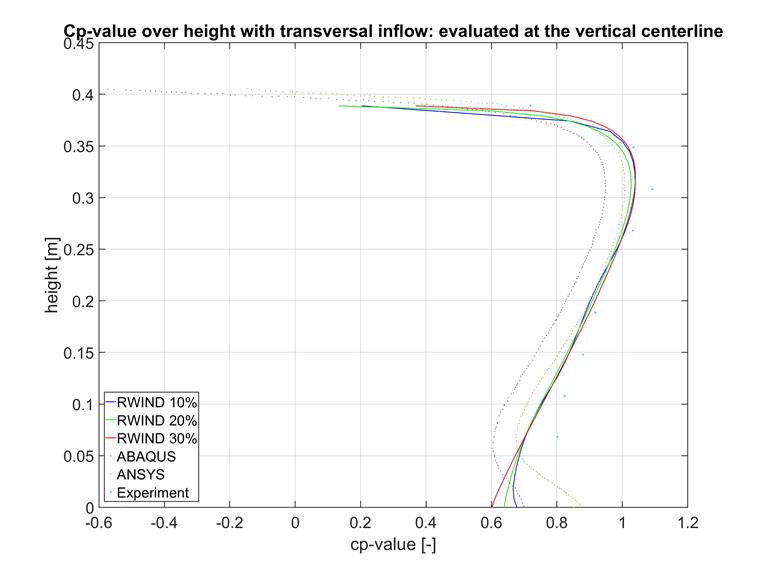
Both the longitudinal as well as the transversal flow were analyzed using two flow profiles each. Because the results of both wind profiles are very similar, only the higher inlet velocity was selected for comparison.
As in the reference study, the Cp values were evaluated on the vertical center line for the longitudinal and transversal flow. In the experiment, sensor data of the central radiosondes were used. Below, the results are given in comparison. The points of the curves from the reference study were read out by the ENGAUGE Digitizer tool and therefore not connected to one another.
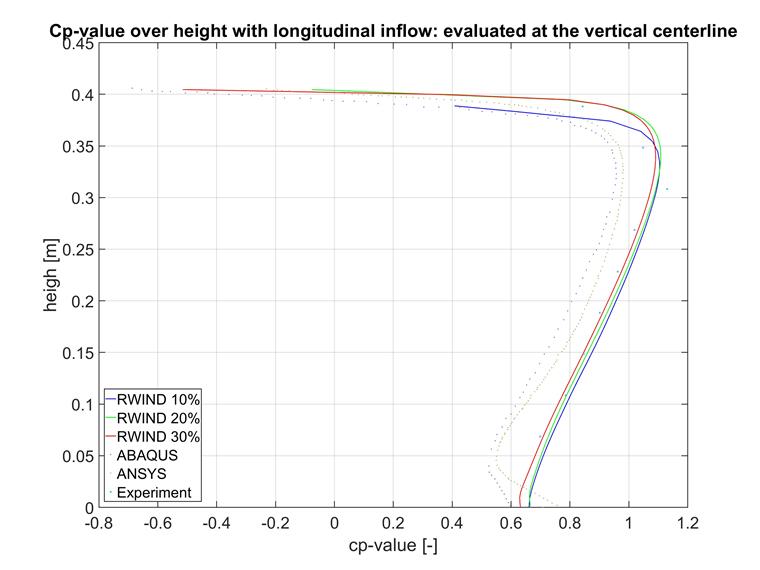
First of all, it can be seen that all three mesh densities correlate well in RWIND. Therefore, a denser mesh is not advisable. The three simulations performed in RWIND seem to hit the points of the experimental benchmark better than the simulations in ABAQUS and ANSYS. The deviation from the other two solvers is very large, especially at the medium height of the test object.
The Cp values' increase towards the ground is noticeable in ABAQUS and ANSYS. The experiment cannot confirm it due to the lack of sensors placed in that area, but the results seem physically illogical. However, this anomaly is not shown by RWIND. Overall, RWIND seems to better hit the experiment's Cp values, despite simpler approach functions and thus less computational effort.
In relation to the longitudinal flow, the same conclusions can be drawn for the transversal flow. The results of the comparison are closer to the experimental benchmark than for the longitudinal flow, but the RWIND results show a comparably good fit. Here, again, an anomaly of the Cp curves can be seen near the ground.
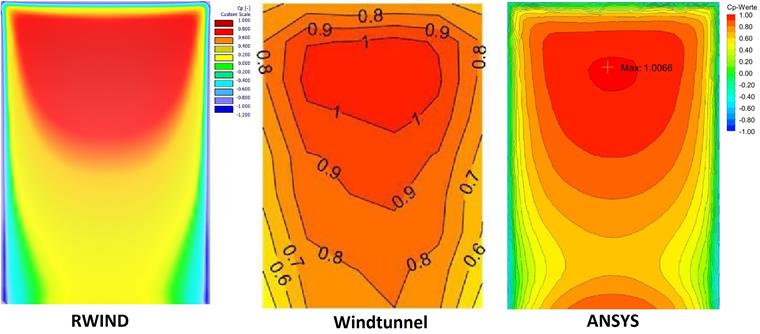
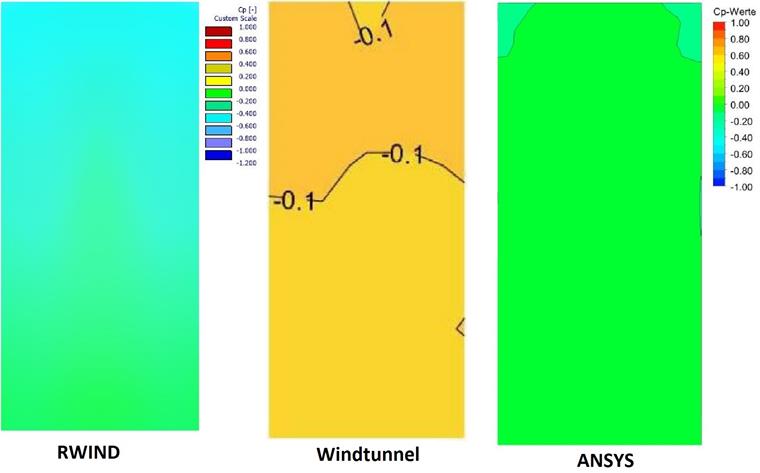
In addition to the evaluation on the vertical center line, the comparison provides false-color images for the Cp value tensor. It is, therefore, advisable to compare the Cp distribution on various surfaces.
The images of the experimental benchmark should be seen with caution. Due to the relatively coarse distribution of pressure sensors, the representation of the level lines is more an assumption than a measurement. The real Cp value is likely to be significantly lower at the edges, since there are no sondes in this critical area.
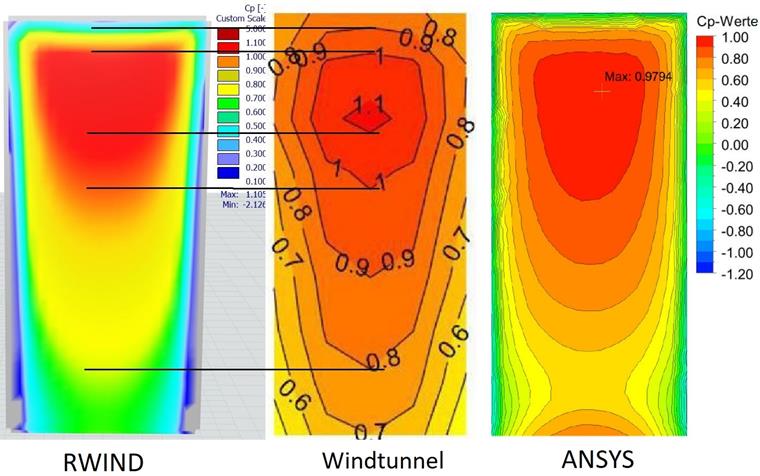
It should be noted here that only half as many discrete color-value ranges are available in the RWIND result display as in ABAQUS and in the experimental analysis, which is why the corresponding value ranges should be compared visually, rather than the colors themselves being compared. Furthermore, for reasons of clarity, only the ANSYS simulation of the reference study is used below. ANSYS tends to have better results; however, overall the results are much more similar than, for example, ABAQUS and RWIND.
For the longitudinal flow of the front side, the findings from the plots of the center line are confirmed. The RWIND simulation seems to hit the specific Cp values over a certain area better than ANSYS, but the distribution is very similar in all sample images.
The increase of values in the ground area in the ANSYS image described above is also shown here, and is not confirmed by either the experiment or RWIND.
It is once again noteworthy that the Cp value decreases sharply towards the edge of the object in all simulations, but not in the experiment. The difference is probably due to the lack of sensors in this area.
Overall, the simulation of the pressure side in RWIND is very convincing, especially with regard to the relatively low resources and modeling effort compared to other programs.
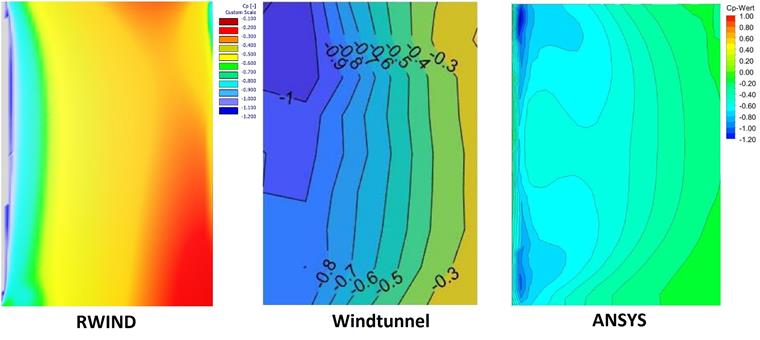
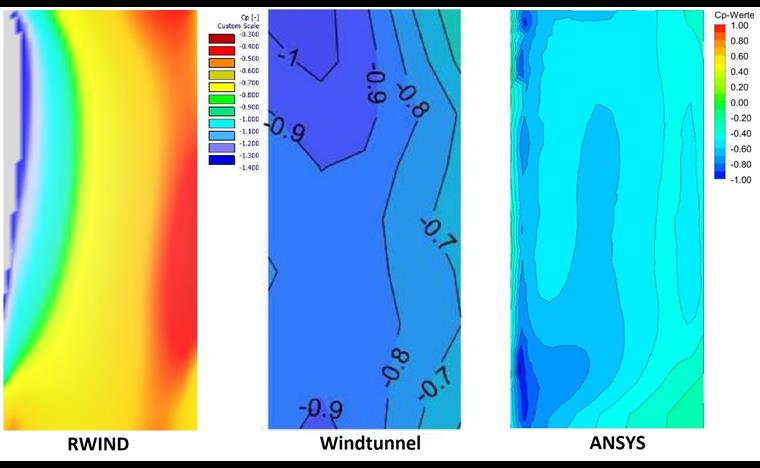
The tendencies of the pressure side do not continue for the suction side. While the level distribution of the Cp values in RWIND is somewhat more in line with the simulation than the ANSYS simulation, the actual values are significantly lower. With the exception of the edge on the flow side, the level distribution in RWIND tends to comform better to the tests than ANSYS. In both CFD simulations, the local minima are on the front edge but are clearly concentrated in ANSYS and distributed over a certain area in RWIND. In ANSYS it is about -1.2, whereas RWIND is again considerably lower, at -2.47. Here, ANSYS clearly shows the more physical behavior. At the end of the flow's far side, this trend is directly reversed. Here, RWIND and ABAQUS are below the value of the tests. Here too, however, this observation is questionable due to the distribution of the pressure probes. The Cp minimum in the ground area of the ANSYS simulation follows the trend already described.
Overall, RWIND seems to provide worse results than ANSYS or ABAQUS on the sides dominated by suction. The simpler element approach could possibly be responsible. A transient analysis in RWIND could, for example, address the clearly overestimated suction areas.
In fact, the results in the transient simulation of RWIND are much better. Both the level distribution and the point values show good conformity with the wind tunnel tests. However, a comparative evaluation using ANSYS would make no sense, since a stationary flow model is available there.
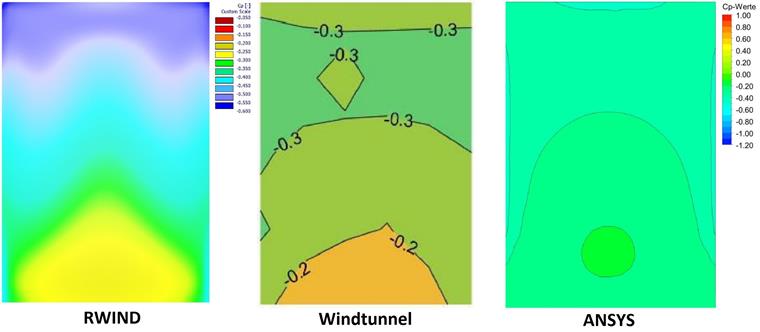
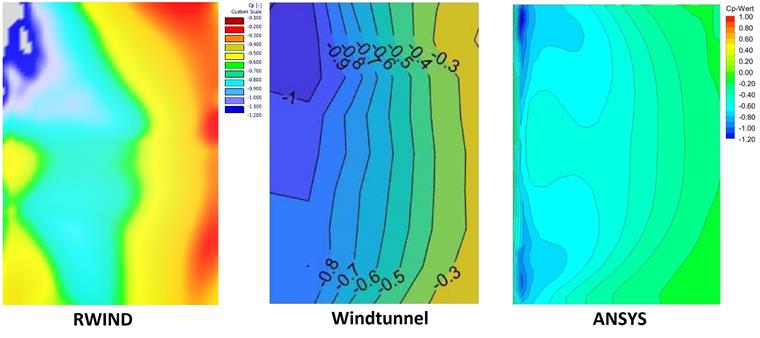
For the rear side, representing another suction area, the differences are even greater. While ANSYS and the tests show good conformity, RWIND calculates significantly lower Cp values and spreads them, according to the amount, higher than the other two images. A transient calculation also provides significantly better results here, comparable to ANSYS, but it was not the subject of this comparison.
The knowledge gained from the comparisons of false-color images showing longitudinal flows also applies to the transversal flow. The comparative images of the lateral flow are shown below, but are not described in detail due to doubling.