
- Realistic representation of interaction between a building and soil
- Realistic representation of the influences of the foundation components on each other
- Extensible library of soil properties
- Consideration of several soil samples (probes) at different locations, even outside the building
- Determination of settlements and stress diagrams as well as their graphical and tabular display

Entering soil layers for soil samples is performed in a clearly arranged dialog box. A corresponding graphical representation supports clarity and makes checking the input user-friendly.
An extensible database facilitates the selection of soil material properties. The Mohr-Coulomb model as well as a nonlinear model with stress and strain dependent stiffness are available for a realistic modeling of the soil material behavior.
You can define any number of soil samples and layers. The soil is generated from all entered samples using 3D solids. Assignment to the structure is carried out using coordinates.
The soil body is calculated according to the nonlinear iterative method. The calculated stresses and settlements are displayed graphically and in tables.
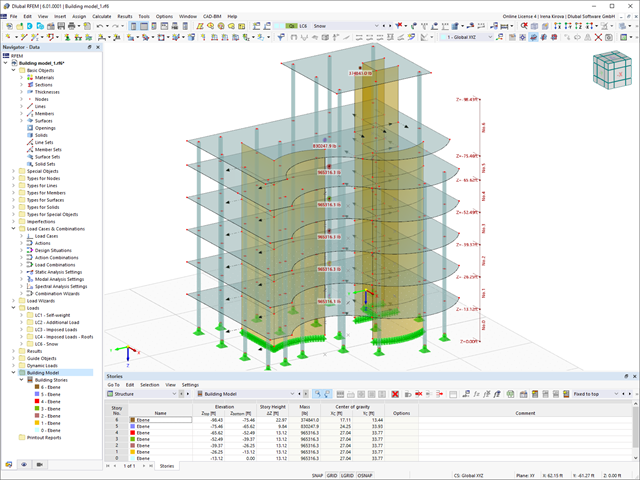
- Consideration and display of story masses
- Listing of structural elements and their information
- Automated creation of result sections on shear walls
- Output of section resultants in global direction for determining shear forces
- Optional definition of rigid diaphragm by story (story modeling)
- Stiffness type Floor Slab - Rigid Diaphragm
- Defining floor sets,
- for example, calculation of slabs as a 2D position within the 3D model
- Shear walls: Automatic definition of result members with any cross-section
- Design of rectangular cross-sections using the Concrete Design add-on
- Definition of deep beams
- Design with the Concrete Design add-on
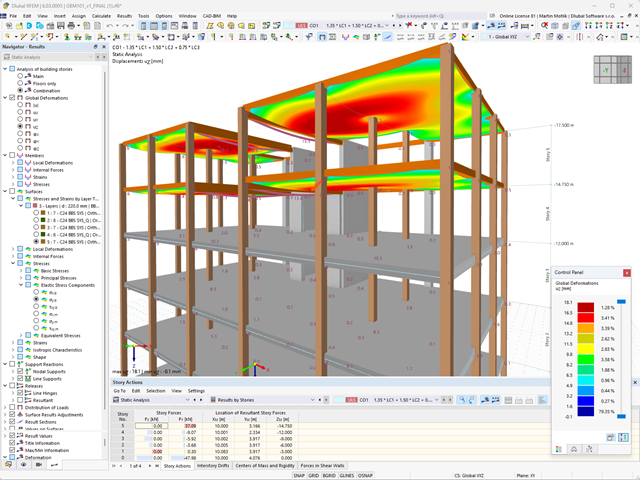
- Tabular output of story actions, interstory drift, and center points of mass and stiffness, as well as the forces in shear walls
- Separate result display of the floor and stiffening design
- Optional neglecting of openings of a certain size
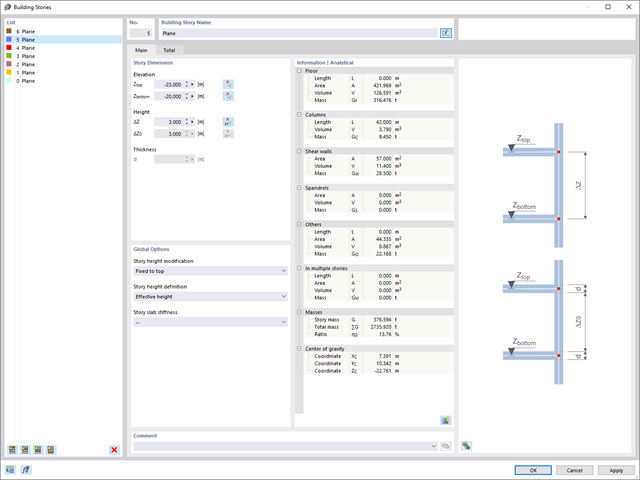
You have two options for a building model. You can create it when you start modeling the structure, or activate it afterwards. In the building model, you can then directly define the stories and manipulate them.
When manipulating the stories, you can choose whether to modify or retain the included structural elements using various options.
RFEM does some of the work for you. For example, it automatically generates result sections, so you don't need to perform a lot of calculations.
You can display the results as usual via the Results navigator. Furthermore, the dialog box of the add-on shows you the information about the individual floors. Thus, you always have a good overview.
Compared to the RF‑SOILIN add-on module (RFEM‑5), the following new features have been added to the Geotechnical Analysis add-on for RFEM 6:
- Creation of the layered soil as a 3D model from the entirety of the defined soil samples
- Recognized material law according to Mohr-Coulomb for soil simulation
- Graphical and tabular output of stresses and strains at any depth of the soil
- Optimal consideration of the soil-structure interaction on the basis of an overall model
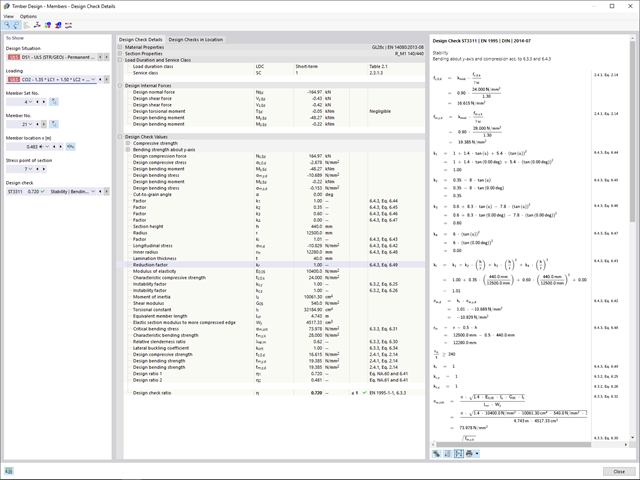
Compared to the RF‑/TIMBER Pro add-on module (RFEM 5 / RSTAB 8), the following new features have been added to the Timber Design add-on for RFEM 6 / RSTAB 9:
- In addition to Eurocode 5, other international standards are integrated (SIA 265, ANSI/AWC NDS, CSA O86, GB 50005)
- Design of compression perpendicular to grain (support pressure)
- Implementation of eigenvalue solver for determining the critical moment for lateral-torsional buckling (EC 5 only)
- Definition of different effective lengths for design at normal temperature and fire resistance design
- Evaluation of stresses via unit stresses (FEA)
- Optimized stability analyses for tapered members
- Unification of the materials for all national annexes (only one "EN" standard is now available in the material library for a better overview)
- Display of cross-section weakenings directly in the rendering
- Output of the used design check formulas (including a reference to the used equation from the standard)
Are you afraid that your project will end in the digital tower of Babel? The Building Model add-on for RFEM supports you in your work on a construction project with several stories. It allows you to define a building by means of stories at specified elevations. You can adjust the stories in many ways afterwards and also select the story slab stiffness. Information about the stories and the entire model (center of gravity, center of rigidity) is displayed for you in tables and graphics.
More About Building Model
Reinforced concrete usually answers the question "How much can you carry?" simply with "Yes". Nevertheless, you need a three-dimensional moment-moment-axial force interaction diagram for the graphical output of the ultimate limit state of reinforced concrete cross-sections. The Dlubal structural analysis software offers you just that.
With the additional display of the load action, you can easily recognize or visualize whether the limit resistance of a reinforced concrete cross-section is exceeded. Since you can control the diagram properties, you can customize the appearance of the My-Mz-N diagram to suit your needs.

Did you know that you can also display the moment-axial force interaction diagrams (M‑N diagrams) graphically? This allows you to display the cross-section resistance in the case of an interaction of a bending moment and an axial force. In addition to the interaction diagrams related to the cross-section axes (My‑N diagram and Mz‑N diagram), you can also generate an individual moment vector to create an Mres‑N interaction diagram. You can display the section plane of the M‑N diagrams in the 3D interaction diagram. The program displays the corresponding value pairs of the ultimate limit state in a table. The table is dynamically linked to the diagram so that the selected limit point is also displayed in the diagram.