


1. Introduction
Wind pressure acting on building surfaces is highly fluctuating due to atmospheric turbulence and flow separation phenomena. While instantaneous pressures may exhibit large peaks, structural design requires representative extreme values associated with specific tributary areas. Two commonly used coefficients are [1]:
* cp,1: Represents local peak pressures acting on small cladding elements with an effective area of approximately 1 m²
* cp,10: Represents pressures acting on larger structural regions with an effective area of approximately 10 m²
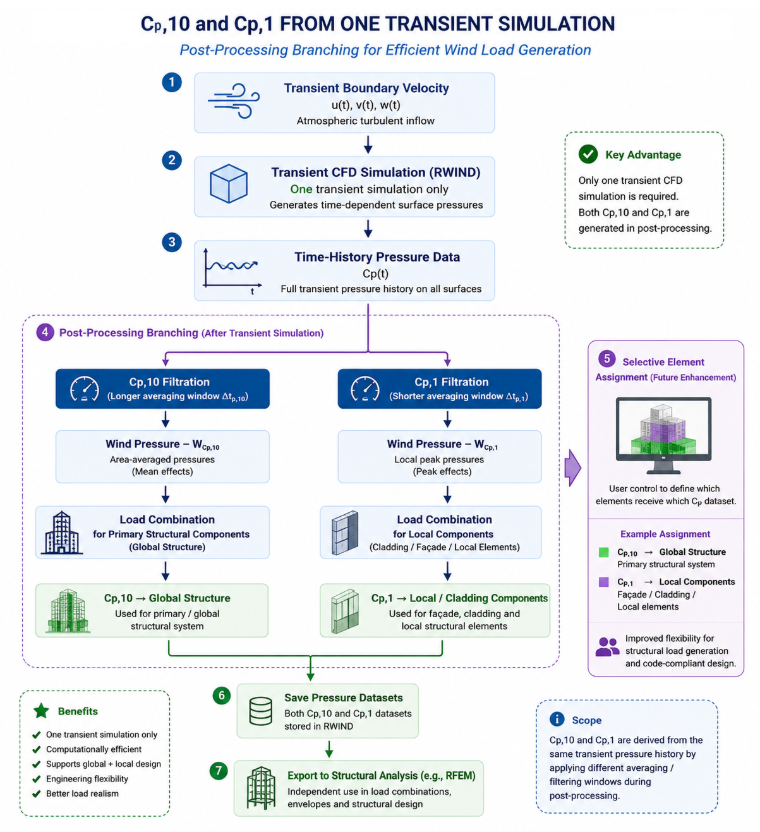
Because larger areas average out small-scale turbulence structures, cp,10 values are generally less severe than cp,1 values. The challenge lies in transforming highly fluctuating pressure signals into statistically meaningful design coefficients. This article presents a complete time-domain methodology for deriving cp,1 and cp,10 through:
- Quasi-steady pressure modeling
- Area averaging
- Load-duration filtering
- Extreme value extraction
- Gumbel distribution fitting
- Gust loading factor correction
The methodology follows the framework of pseudo-steady wind loading theory and provides a physically consistent procedure for converting transient pressure fluctuations into design pressure coefficients.
2. Quasi-Steady Wind Pressure Model
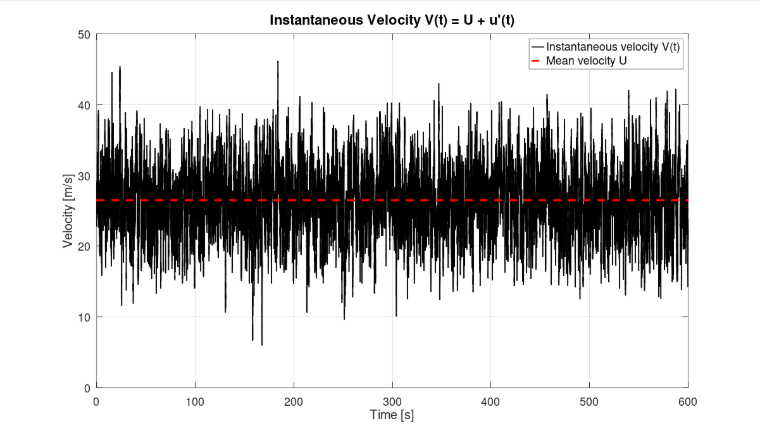
The starting point is the quasi-steady assumption, which relates pressure fluctuations directly to velocity fluctuations. The instantaneous wind velocity is:
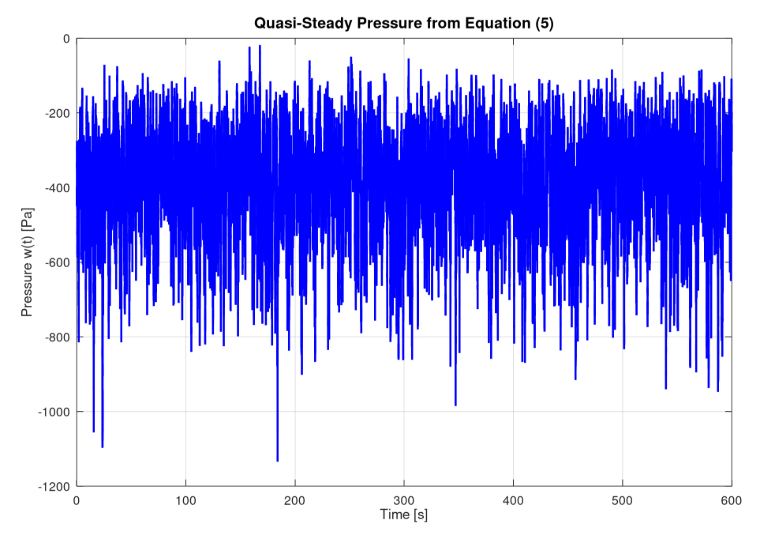
The corresponding pressure is calculated as:
This formulation captures the nonlinear relationship between velocity fluctuations and aerodynamic pressure. For roof suction regions, cp,bar is typically negative.
3. Generation of Pressure Time Histories
A turbulent velocity signal may be obtained from:
- Wind tunnel measurements
- CFD simulations
- Synthetic turbulence generators
- Field measurements
The resulting pressure coefficient time history is cp(t). In practice, additional pressure fluctuations arise from:
- Flow separation
- Vortex shedding
- Local corner vortices
- Turbulent wake interactions
These effects are superimposed on the quasi-steady pressure component to generate a realistic pressure signal.
4. Area Averaging and Load Duration Effects
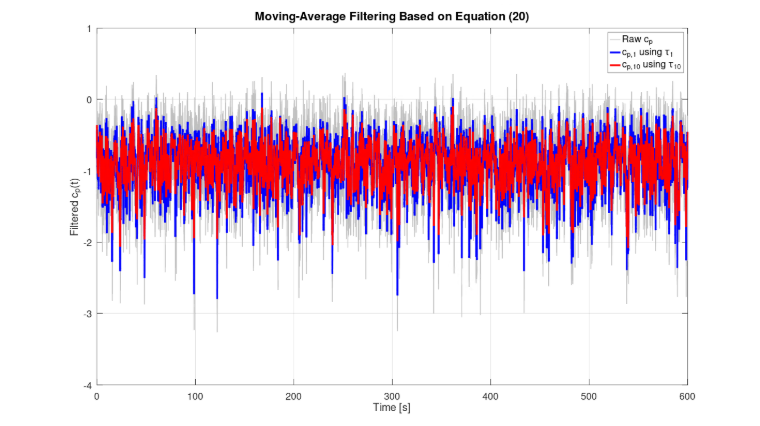
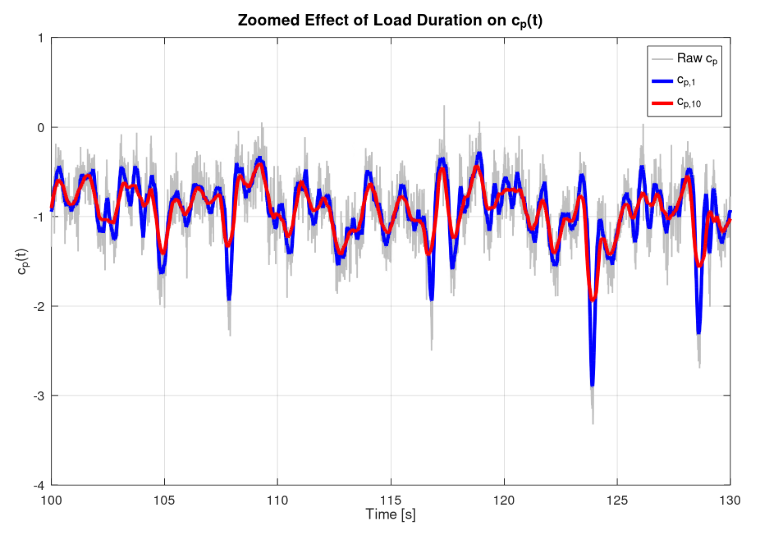
Wind loading standards recognize that pressure peaks become less severe as the loaded area increases. To account for this phenomenon, pressure coefficients are filtered over an equivalent load duration:
Typical values are commonly defined based on the tributary area of the loaded surface, where cp,1 represents the pressure coefficient associated with an effective area of 1 m², while cp,10 corresponds to an effective area of 10 m². As the tributary area increases, the associated load duration and averaging time also increase, resulting in a stronger smoothing effect on the pressure signal. Consequently, the larger averaging time associated with cp,10 filters out a greater portion of the high-frequency pressure fluctuations caused by local turbulence and flow separation. This reduction in short-duration pressure peaks leads to lower extreme suction values compared to cp,1, making cp,10 generally less severe and more representative of the pressures acting on primary structural elements rather than local cladding components.
5. Extraction of Extreme Pressures
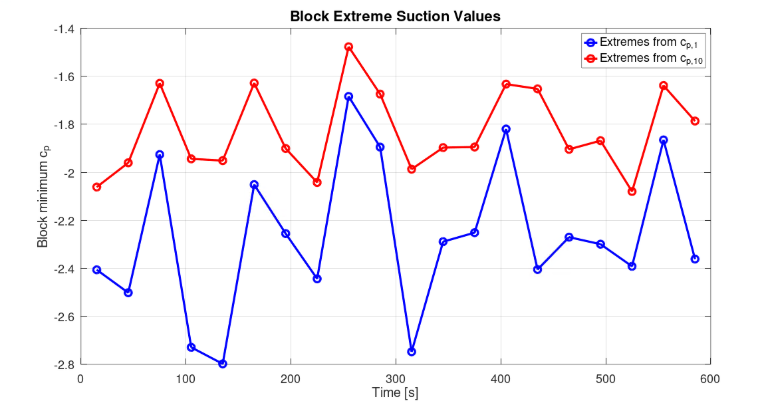
After area averaging, the filtered pressure records are divided into blocks of equal duration. For each block, the minimum pressure coefficient is extracted cp,min. These block minima represent statistically independent extreme events. The procedure transforms thousands of pressure samples into a manageable set of extreme values suitable for probabilistic analysis.
6. Extreme Value Theory and Gumbel Distribution
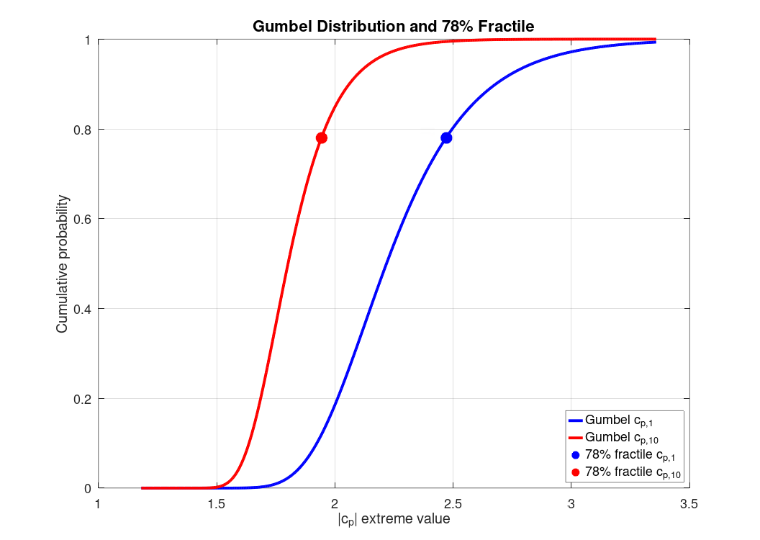
Wind pressure extremes are commonly modeled using the Gumbel distribution. For a sample set of extreme values: X=−cp. The Gumbel parameters are estimated from the sample mean and standard deviation. The cumulative distribution function is:
where:
- μ = location parameter
- β = scale parameter
The Gumbel model provides a continuous representation of the probability of extreme pressure events.
7. Evaluation of the 78% Fractile
Wind engineering standards often define characteristic pressure coefficients using the 78% fractile of the extreme value distribution. The characteristic extreme value becomes:
The 78% fractile provides a robust estimate of design-level pressure peaks while avoiding excessive sensitivity to isolated outliers.
8. Gust Loading Factor
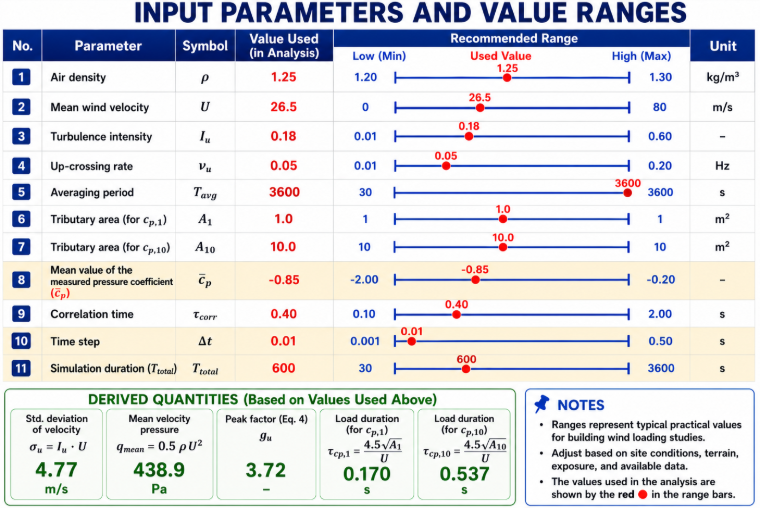
The gust loading factor accounts for amplification due to atmospheric turbulence. The velocity peak factor and the gust loading factor are obtained from:
|
νu |
Mean up-crossing rate |
|
T |
Averaging Period |
|
Iu |
Turbulence Intensity |
|
B²(A) |
Background Factor |
This formulation incorporates turbulence characteristics and spatial averaging effects.
9. Calculation of Final Pressure Coefficients
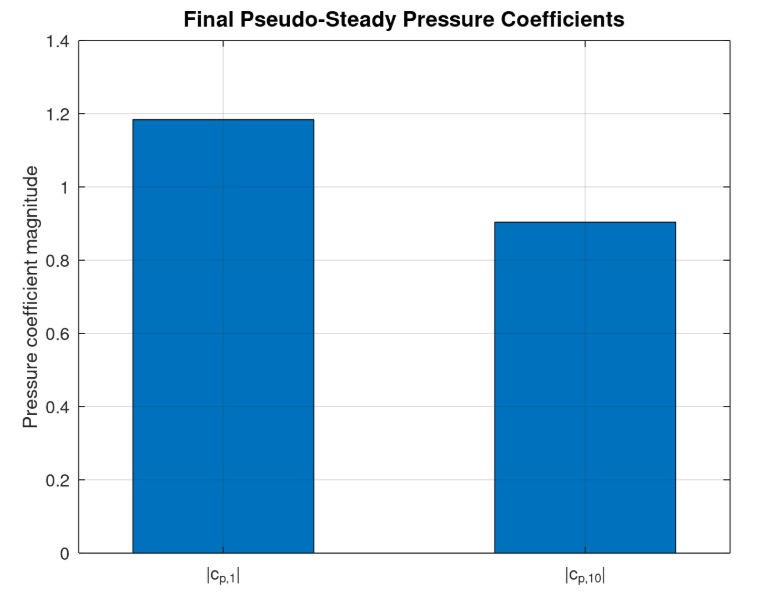
The final pressure coefficients cp,1 and cp,10 are obtained by dividing the characteristic peak pressure coefficients by the corresponding gust factor. This removes the amplification caused by wind turbulence and converts the peak pressures into equivalent pseudo-steady pressure coefficients. The resulting values represent static aerodynamic loading effects that can be directly used for structural design and code-based wind load calculations.
The resulting coefficients represent equivalent static pressure coefficients suitable for structural design.
10. Equivalent Wind Load
The final equivalent wind load acting on a tributary area is
This equation transforms pressure coefficients into design loads directly applicable within structural analysis models.
11. Interpretation of cp,1 and cp,10
The methodology naturally reproduces the well-known area reduction effect:
cp,1
- Sensitive to local vortices
- Higher suction peaks
- Used for cladding and fastener design
- Short averaging duration
cp,10
- Represents larger loaded regions
- Reduced peak suction
- Used for primary structural design
- Longer averaging duration
As the tributary area increases, high-frequency pressure fluctuations are progressively filtered out, reducing extreme pressure coefficients.
12. Advantages of the Time-Domain Methodology
Compared with traditional code-based approaches, the presented procedure offers several advantages:
- Applicable to CFD-generated pressure fields
- Applicable to wind tunnel measurements
- Explicit treatment of turbulence intensity
- Physical representation of area effects
- Consistent extreme value statistics
- Suitable for arbitrary tributary areas
- Direct generation of pseudo-steady design loads
The methodology bridges the gap between transient aerodynamic pressure data and practical structural design parameters.
Conclusion
A comprehensive time-domain framework has been presented for deriving local and structural pressure coefficients, cp,1 and cp,10, from transient wind pressure records. The methodology combines quasi-steady wind loading theory, area averaging, extreme value statistics, and gust factor corrections to generate physically meaningful design coefficients. The approach is particularly valuable for CFD-based wind engineering, where complete pressure time histories are available and traditional code coefficients may not adequately represent complex geometries. By integrating load-duration effects and Gumbel extreme value analysis, the procedure provides a rigorous pathway from transient pressure fluctuations to equivalent static design loads.